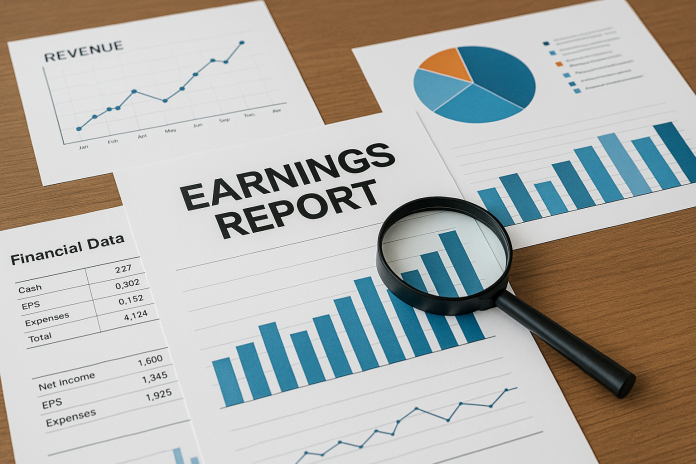
Corporate earnings reports look scary the first time tables, EPS, GAAP, non-GAAP, guidance, segments but they all follow almost the same structure. If you know what to look at first, you can understand in a few minutes whether a company had a good quarter or is trying to hide bad news.
What an Earnings Report Actually Is
A US corporate earnings report is a quarterly update (Form 10-Q) or yearly update (Form 10-K) where a public company tells investors how much money it made, how much it spent, and what it expects in the future. Alongside the SEC filing, companies also publish an “earnings release” and do an earnings call. For news sites and business blogs, the earnings release is usually enough.
The goal for you as a reader is simple: find out if the company grew, if it made profit, and what it says about next quarter.
Start With the Earnings Release, Not the Full 10-Q
The earnings release is the short version. It normally has:
-
headline results (revenue, earnings per share)
-
management comment
-
tables with income statement
-
sometimes guidance
Read this first to get the story before digging into details.
Look at Revenue Before Anything Else
Revenue (sometimes called “net sales” or “total revenues”) tells you if the business is growing. Compare it to:
-
the same quarter last year (year-over-year)
-
the previous quarter (sequential), if it’s a seasonal business
If revenue is up strongly and the company explains why (more customers, higher prices, new product), that’s positive. If revenue is flat but expenses went up, profitability will get worse.
Focus on whether growth is organic (real demand) or just from acquisitions.
Check Earnings Per Share (EPS)
After revenue, EPS is the number most investors watch. It tells you how much profit belongs to each share.
Companies usually show two versions:
-
GAAP EPS (according to accounting rules)
-
non-GAAP or adjusted EPS (removes one-time items)
Adjusted EPS is what the company wants you to look at. GAAP EPS is what actually happened. If the gap between the two is very big, make a mental note to be careful.
Also see if EPS was above or below what analysts were expecting (the company will often mention “beat” or “miss” in the release).
Read the Management Comment for the Story
Right after the headline numbers, there’s usually a paragraph from the CEO or CFO. Don’t skip it.
This part tells you:
-
what drove growth (new product, pricing, region)
-
what headwinds they faced (currency, weak demand, higher costs)
-
how they feel about the next quarter
If the tone is defensive and full of vague phrases like “dynamic macro environment” and “remaining disciplined,” it often means growth is slowing or they missed expectations.
Go to the Income Statement
This is where you see how the money flowed.
Key lines to watch:
-
Revenue
-
Cost of goods sold (COGS)
-
Gross profit and gross margin
-
Operating expenses (R&D, sales & marketing, admin)
-
Operating income
-
Net income
Ask yourself:
-
Did revenue grow faster than expenses?
-
Did margins improve or shrink?
-
Did operating income go up or down?
If revenue went up but operating income fell, the company is spending more to get that growth.
Look at Margins, Not Just Dollars
Margins tell you how efficient the business is. Even if revenue is flat, improving margins can make earnings grow.
Important margins:
-
Gross margin = (Revenue – COGS) ÷ Revenue
-
Operating margin = Operating income ÷ Revenue
-
Net margin = Net income ÷ Revenue
Rising margins = better control of costs or better pricing.
Falling margins = higher input costs, heavy discounting, or more spending.
Check the Balance Sheet for Safety
You don’t have to be an accountant. Just look for three things:
-
Cash and cash equivalents
-
Total debt
-
Shareholders’ equity
If the company has very little cash and a lot of debt while profits are falling, risk is higher. If it has strong cash and manageable debt, it can survive a bad quarter.
See the Cash Flow Statement (Is the Cash Real?)
Income statements can look good because of accounting adjustments. Cash flow is harder to fake.
Focus on cash from operating activities. If the business is healthy, this number should usually be positive and roughly in line with operating income over time.
If the company shows profit but operating cash flow is weak, find out why (inventory build, receivables, one-offs).
Read the Guidance Section
Most US companies tell investors what they expect for the next quarter or the full year. This is called guidance.
This is super important because the market prices the future, not the past.
Pay attention to:
-
Are they raising guidance? (bullish)
-
Are they keeping it the same? (neutral)
-
Are they lowering it? (bearish)
A company can report a good quarter but drop if guidance for next quarter is weak.
Watch for One-Time Items
Sometimes companies sell part of a business, lose a lawsuit, write down assets, or restructure. These can make profit look better or worse than the real operating picture.
That’s why they show adjusted (non-GAAP) numbers. Read the reconciliation table they include — it shows exactly what they removed. If there are too many “adjustments” every quarter, it can be a red flag.
Compare to the Same Quarter Last Year
Quarter-to-quarter can be noisy. A better comparison is year-over-year (Q1 this year vs Q1 last year), especially for seasonal businesses like retail, travel, or advertising.
If revenue, operating income, and EPS are all better than the same quarter last year, it’s usually a solid report.
Put It All Together
A strong earnings report usually has:
-
revenue growth
-
stable or improving margins
-
EPS that meets or beats expectations
-
good cash flow
-
confident guidance
A weak report often shows:
-
slowing or negative revenue
-
margins getting squeezed
-
EPS missing expectations
-
cautious or lower guidance


