Key Points
- Nonfarm payrolls measure the change in U.S. wage and salary jobs outside farming, based on the Bureau of Labor Statistics establishment (payroll) survey.
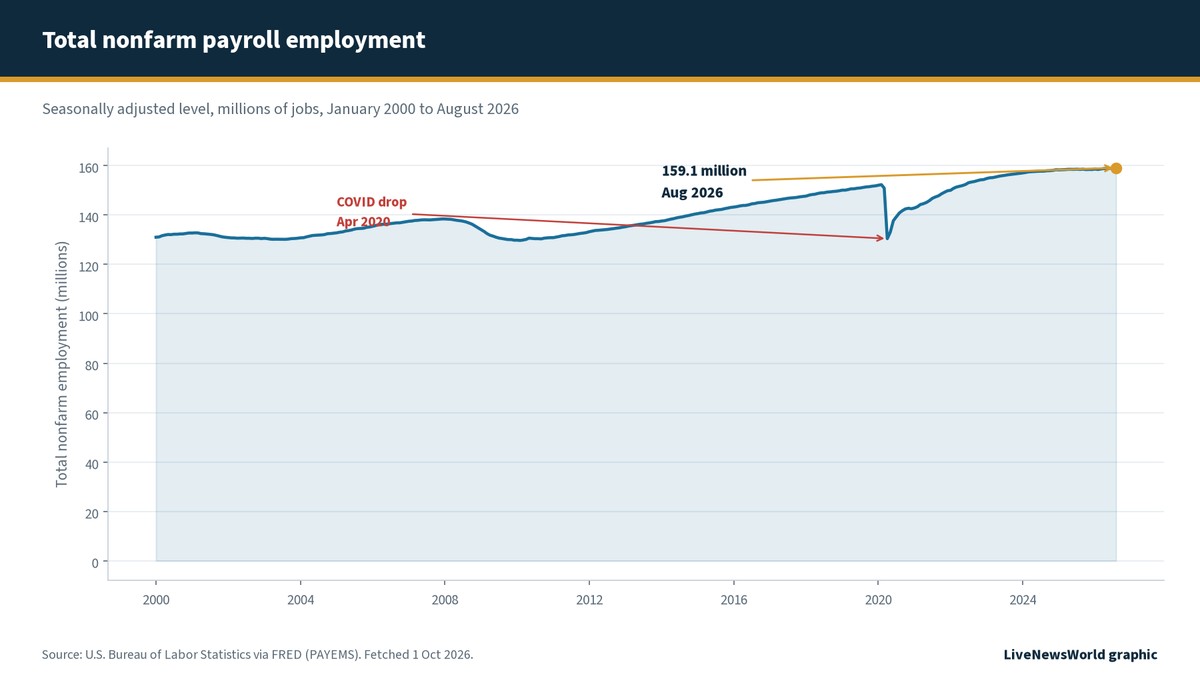
- In August 2026, total nonfarm employment rose by 162,000 to about 159.1 million jobs, while the unemployment rate from the separate household survey was 4.1% (BLS via FRED).
- The first print is revised twice in later Employment Situation releases, then re-anchored each year in the annual benchmark to unemployment-insurance tax records.
- Markets and the Federal Reserve watch nonfarm payrolls because the monthly jobs pulse shapes views on growth, wages, and the path of interest rates.
Nonfarm payrolls are the Bureau of Labor Statistics’ estimate of how many U.S. wage and salary jobs exist outside farming, and how that total changed from the prior month. When headlines say the economy “added 162,000 jobs,” they are almost always citing the seasonally adjusted change in total nonfarm payroll employment from the establishment survey. That figure is one of the most watched data points in global markets because it arrives monthly, covers the bulk of paid work, and feeds into debates about growth, inflation pressure, and Federal Reserve policy.
This explainer covers how nonfarm payrolls are measured, how they differ from the unemployment rate, why revisions happen, and how to read the print alongside other labor-market signals. For a practical guide to following the full Employment Situation package each month, see LiveNewsWorld on how to follow U.S. job market reports.
What are nonfarm payrolls?
Nonfarm payrolls come from the Current Employment Statistics (CES) program, also called the payroll or establishment survey. BLS surveys worksites at businesses and government agencies drawn from unemployment-insurance tax accounts. From those reports, it estimates employment, hours, and earnings for the nation, states, and metro areas.
The headline number is usually the seasonally adjusted month-to-month change in total nonfarm employment. The level matters too: as of August 2026, total nonfarm employment stood at about 159.1 million jobs (159,075 thousand in the FRED PAYEMS series). “Nonfarm” excludes agricultural employment. The series also excludes private household workers, unpaid family workers, and most of the self-employed who do not appear on a payroll.
CES counts jobs, not unique people. Someone who holds two payroll jobs can appear twice. That jobs concept is why nonfarm payrolls can move differently from the household survey’s count of employed persons in the same month.
Establishment survey vs household survey
The monthly Employment Situation news release blends two surveys. Nonfarm payrolls come from the establishment survey. The unemployment rate, labor force participation rate, and employment-population ratio come from the Current Population Survey (CPS), the household survey of about 60,000 eligible households.
The surveys answer different questions. The payroll survey asks employers how many people are on the books, what they are paid, and how many hours they worked. The household survey asks people whether they worked, looked for work, or were outside the labor force. Agriculture, the self-employed, and unpaid family workers show up in the household survey’s employment concept in ways they do not in nonfarm payrolls.
| Feature | Establishment survey (CES) | Household survey (CPS) |
|---|---|---|
| Best known for | Nonfarm payrolls; hours; earnings | Unemployment rate; labor force |
| Who is surveyed | Business and government worksites | About 60,000 eligible households |
| What is counted | Payroll jobs (a person can count twice) | Employed persons (one person, one count) |
| Farming / self-employed | Nonfarm payrolls exclude farm jobs and most self-employment | Broader employment definition includes them |
| Typical market focus | Monthly job change; wage growth | Joblessness; participation; underemployment |
Sources: BLS Employment Situation methods overview (via archived BLS quick guide); household sample size from BLS CPS documentation. Comparison concepts fetched 1 Oct 2026.
Month to month, the two surveys can disagree. That is normal. Sampling noise, different reference periods, and different definitions all play a role. Over longer stretches they usually tell a similar story about whether the labor market is strengthening or softening. When they diverge for several months, analysts dig into revisions, population controls, and sector detail rather than declaring one survey “wrong.”
What the latest nonfarm payrolls print shows
As of the data available on 1 Oct 2026, the latest complete monthly observation for total nonfarm employment is August 2026. Seasonally adjusted payrolls rose by 162,000 from July. The unemployment rate from the household survey was 4.1% in both July and August 2026 (FRED UNRATE). The September 2026 Employment Situation is typically released on the first Friday of October; until that print is out, August remains the latest published month.
| Month (2026) | Nonfarm level (thousands) | Monthly change | Unemployment rate |
|---|---|---|---|
| March | 158,650 | +214,000 | 4.3% |
| April | 158,798 | +148,000 | 4.3% |
| May | 158,861 | +63,000 | 4.3% |
| June | 158,892 | +31,000 | 4.2% |
| July | 158,913 | +21,000 | 4.1% |
| August | 159,075 | +162,000 | 4.1% |
Source: BLS via FRED series PAYEMS and UNRATE, seasonally adjusted. Levels in thousands of jobs. Fetched 1 Oct 2026. Figures may revise in later releases.
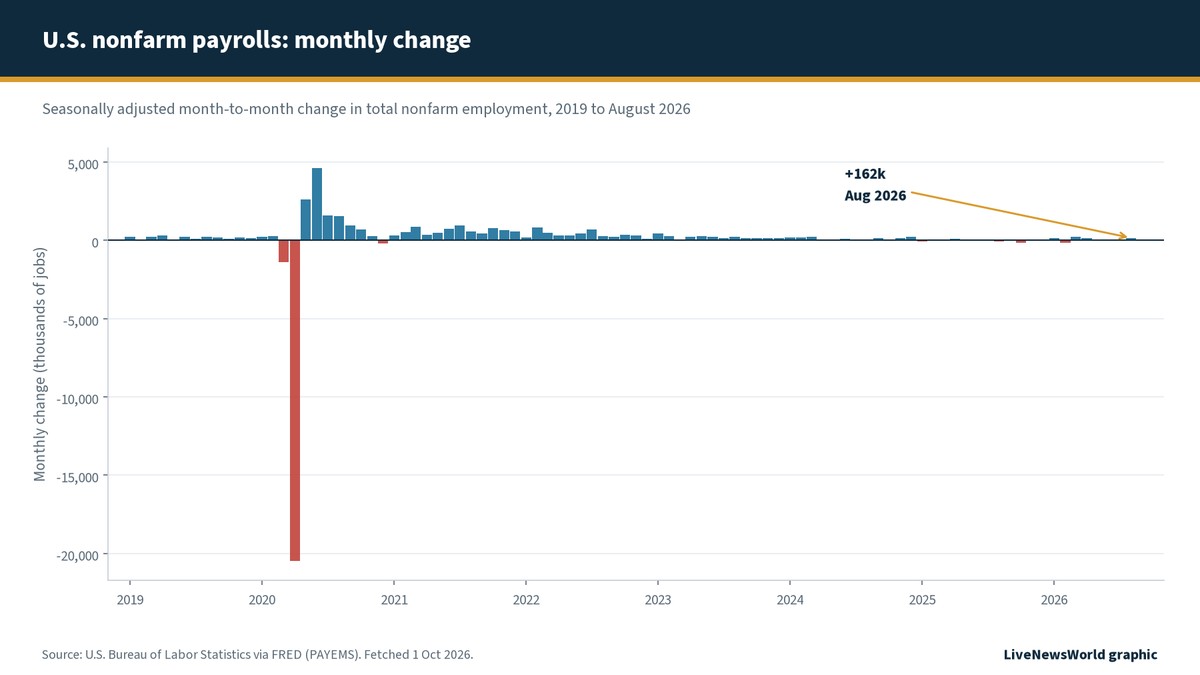
A single month rarely settles the debate. Traders and policymakers often look at three-month averages, industry detail, average hourly earnings, and the unemployment rate together. A hot payroll print with flat wages and a rising jobless rate tells a different story than the same payroll print with accelerating pay.
Why nonfarm payrolls get revised
BLS does not wait for every employer to respond before publishing. First preliminary estimates of employment, hours, and earnings come out about three weeks after the reference period. Those estimates are then revised twice before they are held constant until the annual benchmarking process. The second preliminary estimate appears the following month. The final sample-based estimate appears two months after the initial release.
That revision path exists because more sample responses arrive over time. Early collection rates are incomplete by design. Later months fill in reports that were not ready on the first Friday. Revisions can move the monthly change by tens of thousands of jobs in either direction. Large swings after recessions or abrupt sector shocks are not unusual.
Once a year, CES is benchmarked to nearly complete counts from unemployment-insurance tax records. The benchmark re-anchors the March employment level and revises the path around it. Benchmark revisions are a standard quality-control step, not a surprise “gotcha.” They can still matter for markets when the adjustment is large, because they rewrite the recent history that Fed watchers and investors had been using.
CES also uses a birth-death model to estimate jobs at new firms that the sample cannot capture quickly, and to account for firm deaths. In stable periods the model is a technical adjustment. In sharp turning points it can contribute to larger revisions once hard counts arrive.
Why the Fed and markets watch nonfarm payrolls
Labor-market strength feeds into spending, wage pressure, and inflation dynamics. The Federal Reserve’s dual mandate covers maximum employment and stable prices. A cooling jobs trend can support the case for easier policy. A tight market with rising pay can reinforce the case for keeping rates restrictive. That is why the Employment Situation release often moves the dollar, Treasury yields, and equity futures within seconds.
Nonfarm payrolls are not the Fed’s only labor signal. Policymakers also watch the unemployment rate, job openings, quits, claims, and wage measures. Still, the payroll print is the monthly anchor that frames the conversation between FOMC meetings. LiveNewsWorld’s explainers on the federal funds rate and core inflation sit in the same policy cluster: jobs data help markets judge how long restrictive rates may last, and inflation data help judge whether that stance is working.
For households, the same report is a pulse check on hiring and pay. Industry detail shows which sectors are adding or cutting jobs. Average weekly hours can hint at whether employers are stretching existing staff or preparing to hire. None of those details replace your local market, but they shape the national narrative that influences rates on mortgages, auto loans, and credit cards.
How to read nonfarm payrolls without overreacting
Start with the seasonally adjusted monthly change, then check revisions to the prior two months. A “beat” that comes with large downward revisions to earlier months is not the same story as a clean beat with upward revisions.
Next, read the unemployment rate and labor force participation from the household survey. Payroll gains with a rising unemployment rate can mean more people are entering the labor force, or that the two surveys are temporarily out of sync. Then look at average hourly earnings for inflation-relevant wage pressure, and at industry breakdowns for concentration risk (for example, whether gains are broad or driven by one or two sectors).
Finally, place the print in context with weekly jobless claims and other timely indicators. One Friday does not define a cycle. A sequence of soft or strong prints does.
Common misconceptions about nonfarm payrolls
“Nonfarm payrolls are the unemployment rate.” They are not. Payrolls count jobs from employers. The unemployment rate comes from the household survey and measures the share of the labor force that is jobless and actively looking for work.
“A revision means the first number was fake.” Revisions are built into the design. Early estimates trade some accuracy for speed. Later estimates and the annual benchmark improve the historical record.
“If payrolls rise, everyone is better off.” Aggregate job growth can coexist with weak hiring in specific regions or industries, and with falling real wages if prices rise faster than pay. Aggregate statistics are a national average, not a personal forecast.
“Farm jobs are the only exclusion that matters.” Farming is the namesake exclusion, but the payroll concept also differs from household employment on self-employment, multiple jobholding, and other definitional edges. Those gaps are why BLS publishes research comparisons between the surveys.
Video: how the jobs report really works
CNN’s short explainer walks through why the headline jobs number and the unemployment rate can seem to conflict, and how the two BLS surveys fit together. Preview the embed before relying on it in a live post.
Video: “How the jobs report really works,” CNN. Title and publisher verified via YouTube oEmbed on 1 Oct 2026.
Frequently asked questions
What does “nonfarm” mean in nonfarm payrolls?
It means the estimate excludes agricultural employment. The series focuses on wage and salary jobs at nonfarm establishments, which covers the vast majority of U.S. payroll employment. It is not a measure of every form of work in the economy.
Why do nonfarm payrolls and the unemployment rate sometimes move in different directions?
They come from different surveys with different concepts. Payrolls can rise while the unemployment rate stays flat or edges up if more people enter the labor force, if multiple jobholding changes, or if sampling noise pushes the two estimates apart for a month or two.
How often are nonfarm payrolls revised?
Each monthly estimate is revised twice in subsequent Employment Situation releases, then can change again in the annual benchmark to tax records. Always check whether a commentary is using the first print or a later revision.
Where can I find the official series?
BLS publishes the Employment Situation news release and CES tables. The St. Louis Fed’s FRED database carries the total nonfarm series as PAYEMS, which is a convenient way to chart history when you want a machine-readable download. See FRED PAYEMS for the series used in this article’s charts.
The bottom line
Nonfarm payrolls are the establishment survey’s monthly scorecard for U.S. payroll jobs outside farming. They differ from the household survey’s unemployment rate, they revise as more reports arrive, and they matter because hiring trends influence growth, wages, and the Federal Reserve’s policy path. Read the first print, then the revisions, then the companion household indicators, before treating any single Friday as a full story.