Key Points
- The unemployment rate is the share of the labor force that is jobless and actively looking for work; the labor force participation rate is the share of the civilian noninstitutional population that is either working or actively looking.
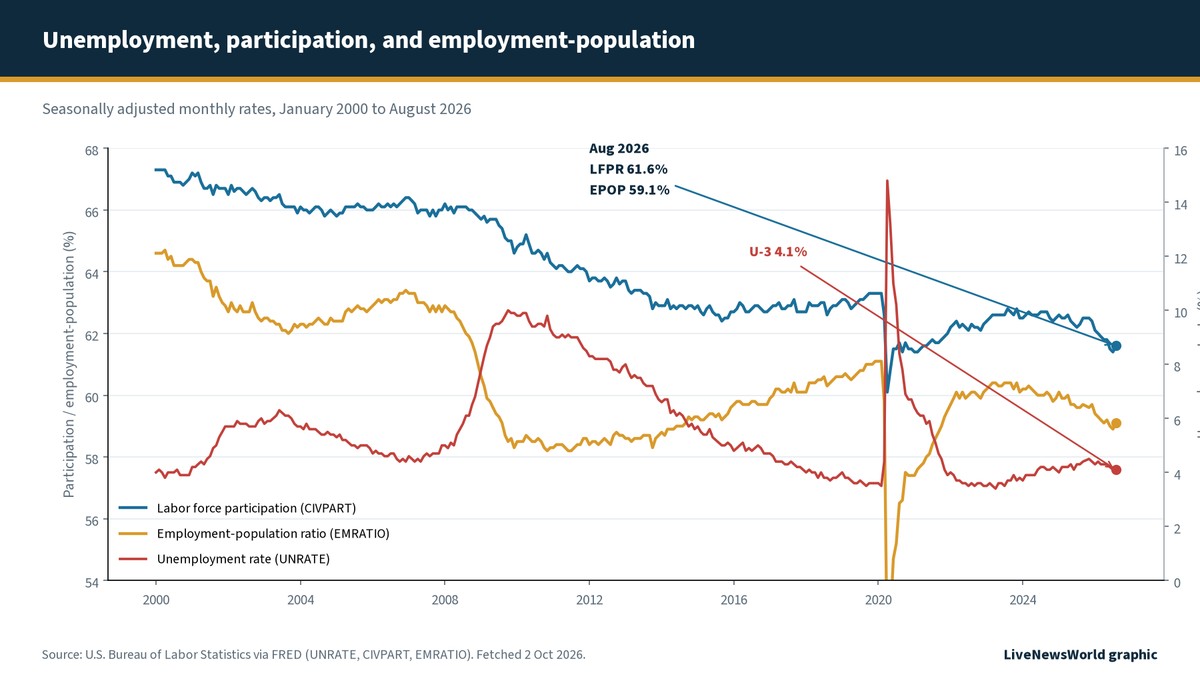
- As of August 2026, the latest complete month in FRED on the morning of 2 Oct 2026 PKT, the unemployment rate was 4.1%, labor force participation was 61.6%, and the employment-population ratio was 59.1% (BLS via FRED).
- The two rates can diverge because people who stop looking leave the labor force: that can lower unemployment even when hiring is weak, or raise participation while unemployment holds steady if new job seekers enter.
- The employment-population ratio (employed people divided by population) helps cross-check both measures because it does not depend on who is counted inside the labor force.
The unemployment rate and the labor force participation rate are both headline labor-market statistics from the same household survey, but they answer different questions. Unemployment asks what share of people who are in the labor force cannot find work. Participation asks what share of working-age civilians are in the labor force at all. Confusing the two is one of the most common ways readers misread the monthly jobs report.
This explainer defines each measure in Current Population Survey (CPS) terms, shows why they can move in different directions, and places the employment-population ratio beside them as a third check. For the payroll side of the same release, see LiveNewsWorld on nonfarm payrolls and how to follow U.S. job market reports.
What the unemployment rate measures
The official U-3 unemployment rate is the number of unemployed people divided by the civilian labor force. To be counted as unemployed in the CPS, a person without a job must be available to work and must have actively looked for work in the prior four weeks (or be on temporary layoff). People who are neither working nor looking are classified as not in the labor force, not as unemployed.
That definition is why a falling unemployment rate is not automatically “good news” in isolation. If large numbers of people stop searching and leave the labor force, the denominator shrinks and the unemployment rate can decline even if employment is soft. Conversely, a rising unemployment rate can accompany a healthier market if more people start looking and temporarily swell the ranks of the unemployed before they find jobs.
BLS also publishes broader measures such as U-6, which include discouraged workers and those working part time for economic reasons. Those wider gauges are useful when you want underutilization, not just the headline U-3 rate. This article focuses on U-3 because it is the figure most market headlines cite.
What the labor force participation rate measures
The labor force participation rate is the civilian labor force divided by the civilian noninstitutional population (age 16 and over, not in institutions such as prisons or nursing homes, and not on active duty in the Armed Forces). The labor force equals employed plus unemployed. So participation rises when more people work or look for work, and falls when more people sit outside both categories.
Participation moves for cyclical and structural reasons. In a deep downturn, some people give up searching and participation dips. Over longer horizons, aging, schooling, disability, caregiving, and retirement patterns can shift the rate even when the business cycle is calm. That is why a participation reading needs demographic context, not only a one-month narrative.
Because participation uses population in the denominator, it answers a different question from unemployment. A country can have a low unemployment rate and still have a large share of adults outside paid work if many people are retired, in school, or otherwise not seeking jobs.
Unemployment rate vs labor force participation: the key differences
| Feature | Unemployment rate (U-3) | Labor force participation rate |
|---|---|---|
| Core question | Of people in the labor force, what share is jobless and looking? | Of the working-age civilian population, what share is working or looking? |
| Formula | Unemployed / labor force | Labor force / civilian noninstitutional population |
| Survey | CPS household survey | Same CPS household survey |
| People outside the labor force | Excluded from the rate | Included in the denominator (they lower participation) |
| Can fall when hiring is weak? | Yes, if job seekers stop looking | Yes, for the same reason (and for structural exits) |
| Best paired with | Participation; employment-population; payrolls | Unemployment; employment-population; demographics |
Definitions follow BLS Current Population Survey concepts as summarized in Employment Situation documentation and FRED series notes. Comparison prepared 2 Oct 2026.
Why the two rates diverge
They share a survey, but not a denominator. Unemployment divides by the labor force. Participation divides by population. Flows between “employed,” “unemployed,” and “not in labor force” therefore hit the two rates differently.
Example path A: hiring slows and some unemployed workers stop sending applications. They leave the labor force. Unemployment can fall or stabilize while participation slips. Headline joblessness looks better; engagement looks worse.
Example path B: optimism or necessity pulls people back into searching. Participation rises. Some new entrants take time to find jobs, so unemployment can edge up even as the broader market is expanding. That pattern often appears early in recoveries.
Example path C: employment rises and unemployment falls while participation is flat. That usually means a larger share of an unchanged labor force is working. The employment-population ratio typically rises in that case and confirms the improvement.
None of these paths requires one survey to be “wrong.” They require readers to track more than one ratio.
The employment-population ratio as a cross-check
The employment-population ratio (often shortened to EPOP) is employed persons divided by the civilian noninstitutional population. It ignores the unemployed-versus-not-in-labor-force split. If employment is rising relative to population, EPOP rises whether or not those workers previously counted as unemployed.
That makes EPOP a useful tie-breaker when unemployment and participation send mixed signals. A falling unemployment rate with a falling EPOP is a weaker story than a falling unemployment rate with a rising EPOP. Markets and Fed watchers often glance at all three before rewriting the labor narrative.
What the latest readings show
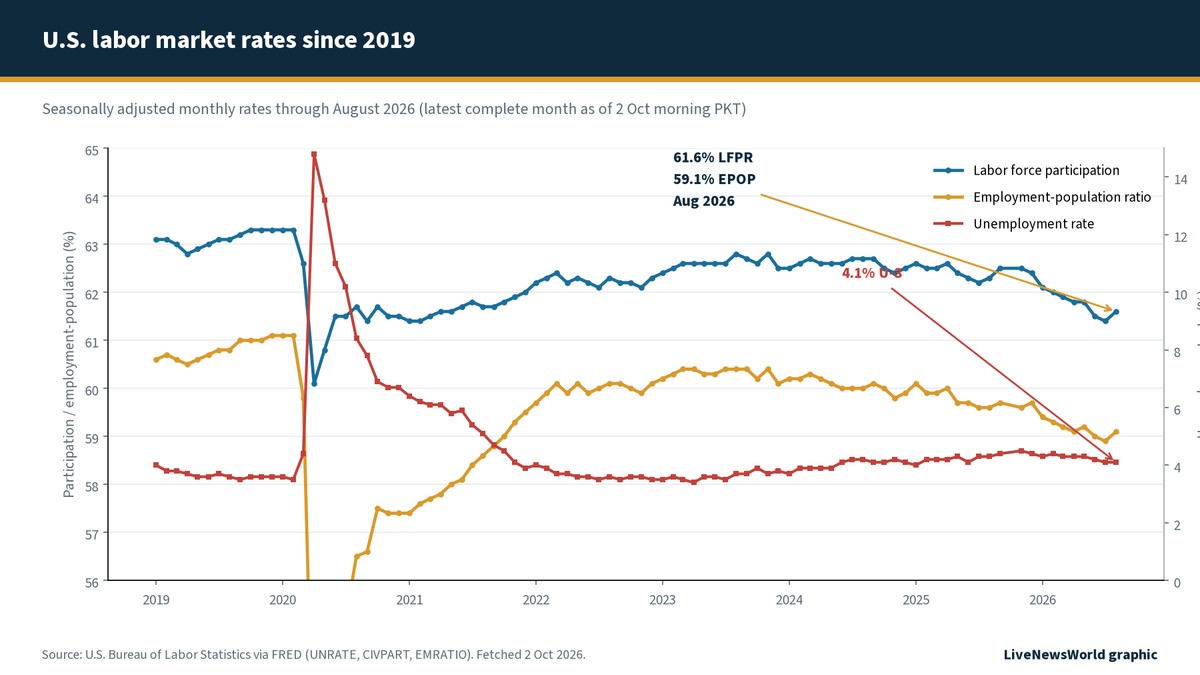
As of the morning of 2 Oct 2026 PKT, FRED’s latest complete monthly observations for these seasonally adjusted series were August 2026. The September 2026 Employment Situation is scheduled for Friday, October 2, 2026, at 8:30 a.m. Eastern Time (5:30 p.m. PKT). Until that release appears in BLS/FRED, August remains the latest published month.
In August 2026, the unemployment rate was 4.1%, the labor force participation rate was 61.6%, and the employment-population ratio was 59.1%. July readings were 4.1%, 61.4%, and 58.9%, respectively. Participation and EPOP both ticked up 0.2 percentage point in August while U-3 was unchanged.
| Month | Unemployment rate | Labor force participation | Employment-population ratio |
|---|---|---|---|
| Mar 2026 | 4.3% | 61.9% | 59.2% |
| Apr 2026 | 4.3% | 61.8% | 59.1% |
| May 2026 | 4.3% | 61.8% | 59.2% |
| Jun 2026 | 4.2% | 61.5% | 59.0% |
| Jul 2026 | 4.1% | 61.4% | 58.9% |
| Aug 2026 | 4.1% | 61.6% | 59.1% |
Source: BLS via FRED series UNRATE, CIVPART, and EMRATIO, seasonally adjusted. Fetched 2 Oct 2026. September 2026 figures were not yet in FRED at packaging time.
Over the longer chart since 2000, participation has drifted lower than its early-2000s levels, with a sharp COVID drop and only a partial rebound. Unemployment spiked in 2020 and then returned to a much lower range. EPOP recovered from the pandemic trough but remains a cleaner check on whether employment is keeping up with population.
How markets and the Fed use these measures
Policymakers care about maximum employment, not only the unemployment rate. A soft unemployment print with falling participation can look like cooling engagement. A stable unemployment rate with rising participation can look like a labor market still absorbing supply. That distinction feeds debates about wage pressure, slack, and the path of the federal funds rate.
Market pricing often reacts first to nonfarm payrolls, then to unemployment, then to the details. Participation and EPOP are among those details. So are revisions, population controls, and the breakdown by age and sex. A single tenth of a percentage point rarely settles a cycle. A several-month pattern can.
How to read the three rates together
Use a simple checklist on Employment Situation day:
1. Note the unemployment rate and its one-month change.
2. Check whether participation rose, fell, or held steady.
3. Confirm with the employment-population ratio.
4. Compare the household story with nonfarm payrolls from the establishment survey.
5. Wait for revisions before rewriting a multi-month trend.
If unemployment falls, participation rises, and EPOP rises, the household survey is telling a broad strengthening story. If unemployment falls only because participation collapses, treat the improvement as incomplete. If unemployment rises while participation and EPOP rise, dig into whether new entrants are still finding jobs quickly.
Common misconceptions
“A low unemployment rate means almost everyone is working.” No. It means almost everyone in the labor force is working. Large groups can be outside the labor force entirely.
“Participation is just the flip side of unemployment.” No. They share the labor force concept, but participation divides by population and unemployment divides by the labor force.
“If payrolls are strong, household rates must improve the same month.” Not necessarily. The establishment and household surveys differ in sample, concept, and noise. Over longer stretches they usually agree on direction; month to month they can diverge.
“October 2025 is missing because the series broke.” FRED shows a blank October 2025 observation for these series in the files fetched for this article. When a monthly value is unavailable, skip it rather than inventing a fill. Always use the latest published complete month.
Video: unemployment from the St. Louis Fed
The Federal Reserve Bank of St. Louis Economic Lowdown series explains how unemployment is defined and why the labor force boundary matters. Preview the embed before relying on it in a live post.
Video: “Unemployment – Economic Lowdown,” Federal Reserve Bank of St. Louis. Title and publisher verified via YouTube oEmbed on 2 Oct 2026.
Frequently asked questions
What is the difference between the unemployment rate and labor force participation?
Unemployment is jobless job-seekers as a share of the labor force. Participation is the labor force as a share of the civilian noninstitutional population. One measures joblessness among people engaged with the market; the other measures how large that engaged group is.
Can the unemployment rate fall for bad reasons?
Yes. If people stop looking for work, they leave the labor force and are no longer counted as unemployed. The unemployment rate can improve while fewer adults are working or seeking work. Check participation and the employment-population ratio before celebrating.
Which measure should I watch with nonfarm payrolls?
Watch all three household rates plus payrolls. Payrolls count jobs from employers. Household rates describe people. Together they answer whether hiring, joblessness, and engagement are moving in the same direction.
Where are the official series?
BLS publishes them in the monthly Employment Situation. FRED carries unemployment as UNRATE, participation as CIVPART, and the employment-population ratio as EMRATIO. See FRED UNRATE for the unemployment series used in this article’s charts.
The bottom line
The unemployment rate and the labor force participation rate are partners, not synonyms. Unemployment tracks joblessness inside the labor force. Participation tracks how many adults are in that labor force. The employment-population ratio helps resolve mixed signals. As of August 2026, those readings were 4.1%, 61.6%, and 59.1%. Read them together with nonfarm payrolls, and refresh the latest month after the September Employment Situation is published.