Six-Slide Visual Analysis
Key Points
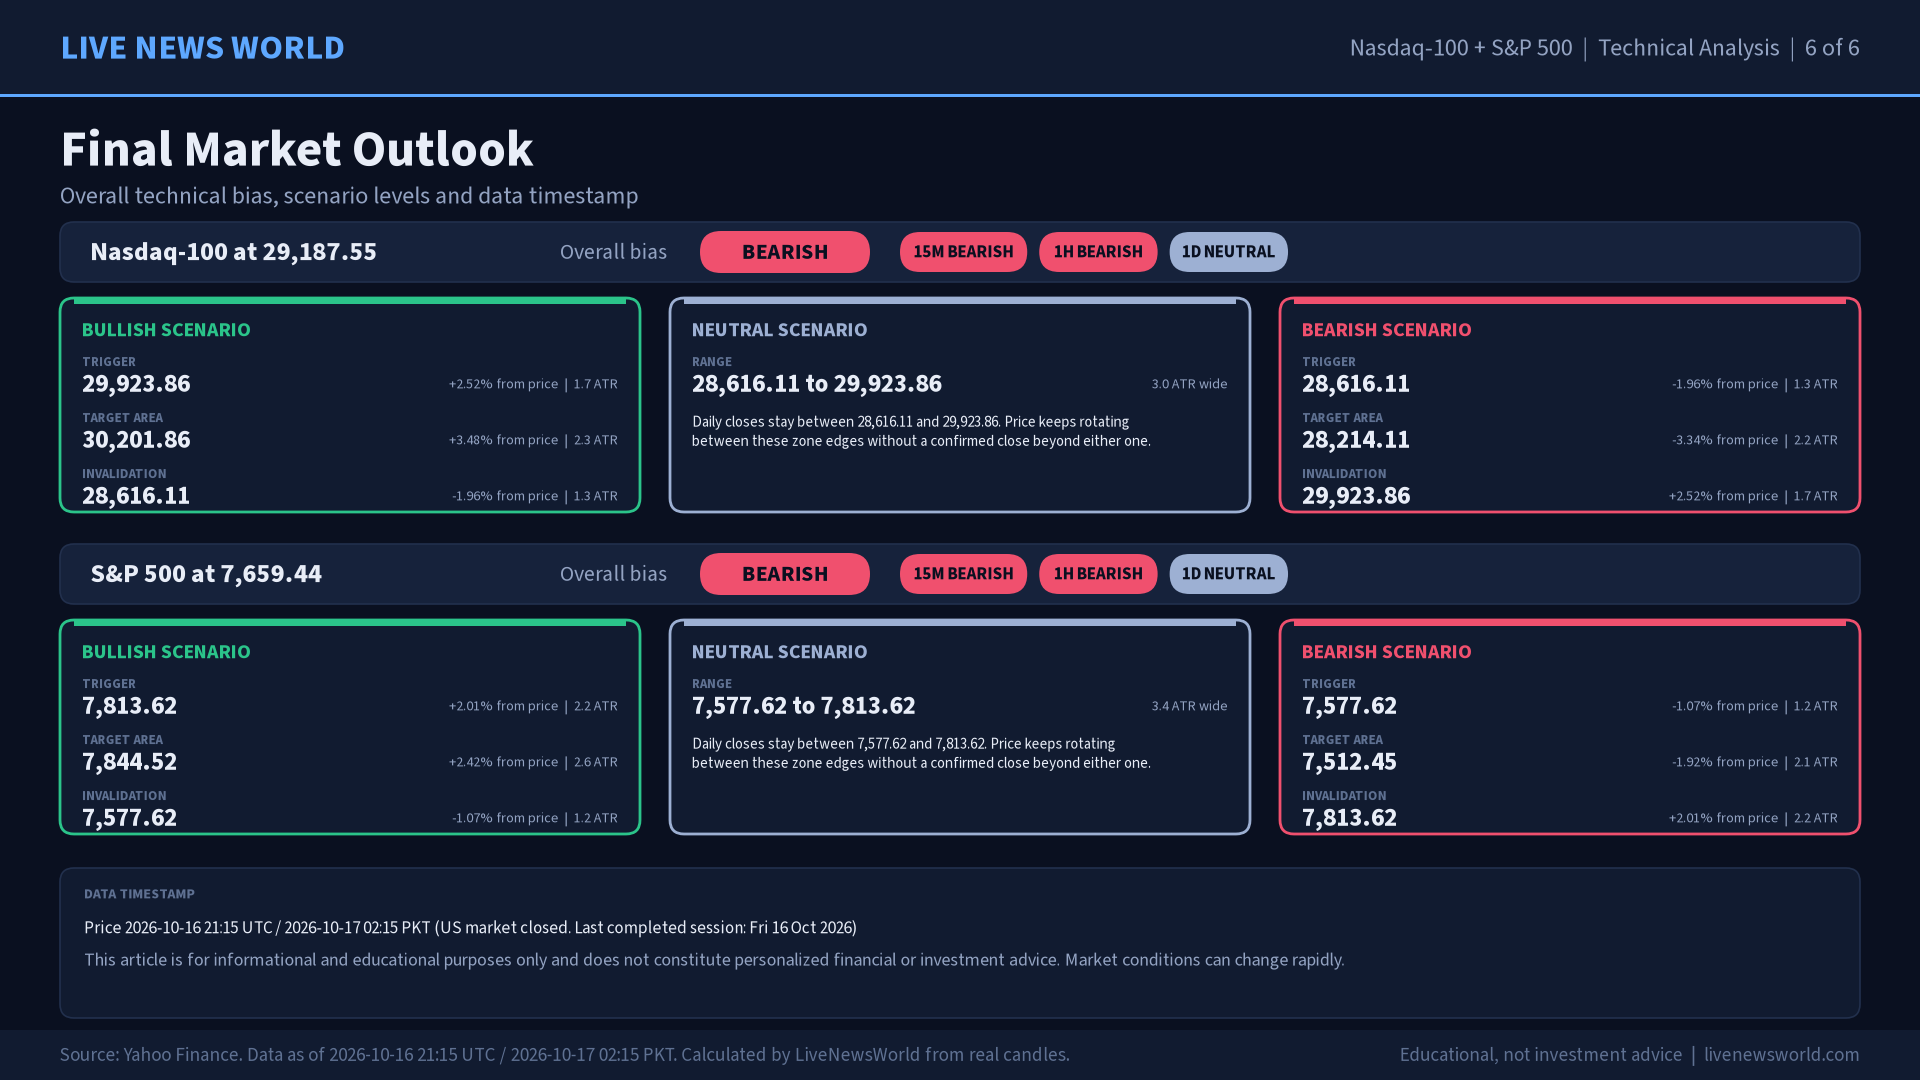
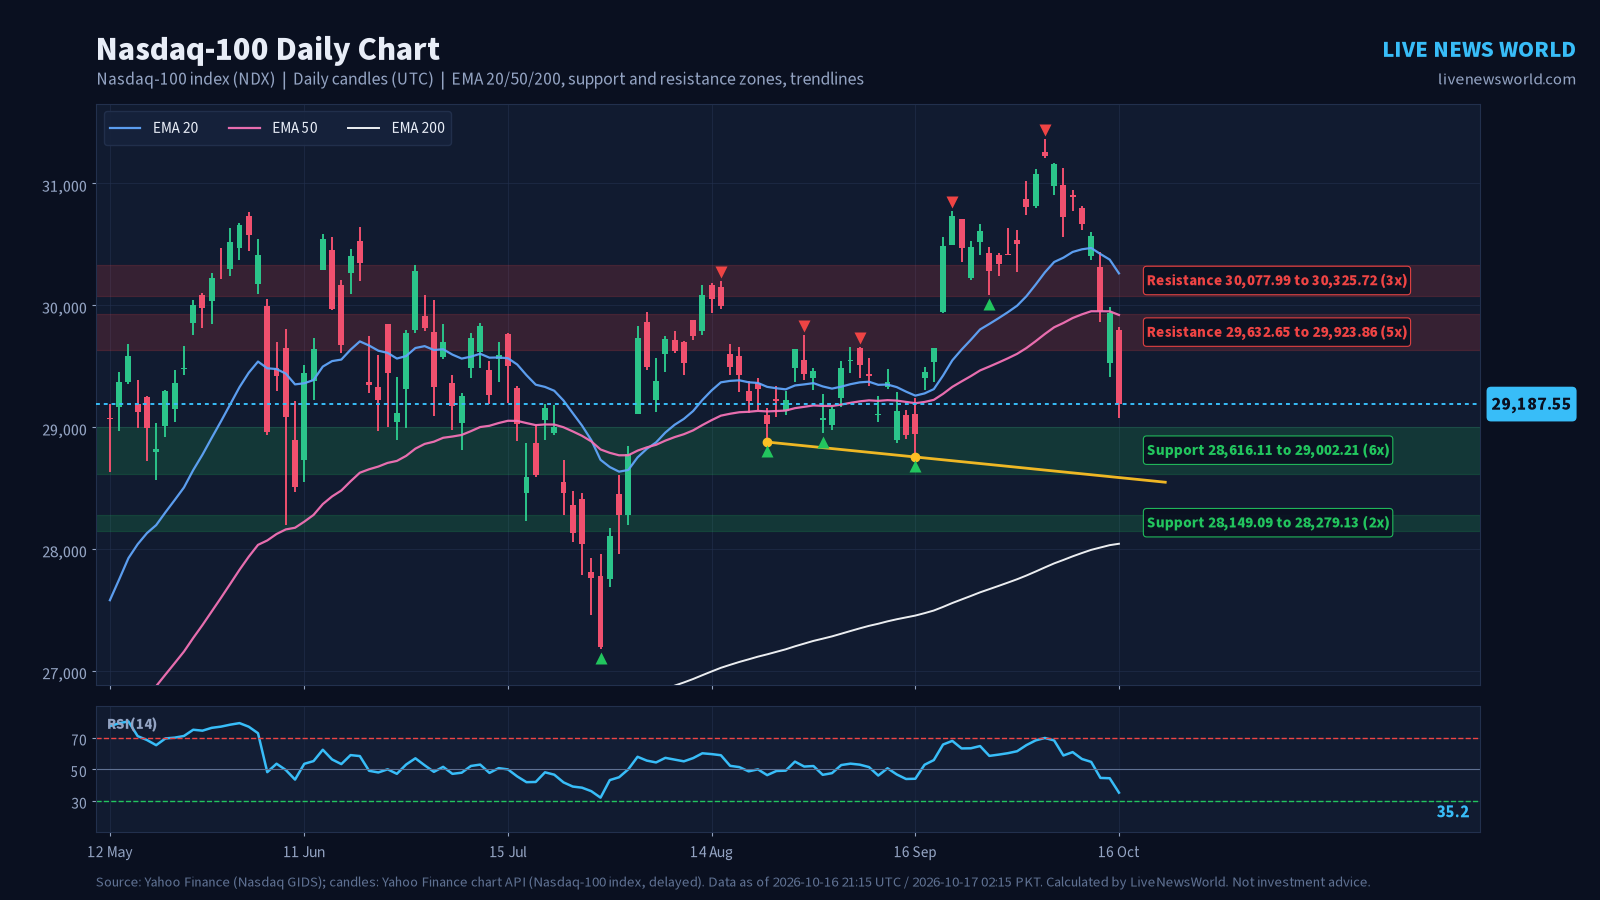
- Nasdaq-100 closed the Friday 16 October session at 29,187.55 (-748.05 points, -2.50%). Daily trend: uptrend, overall bias bearish.
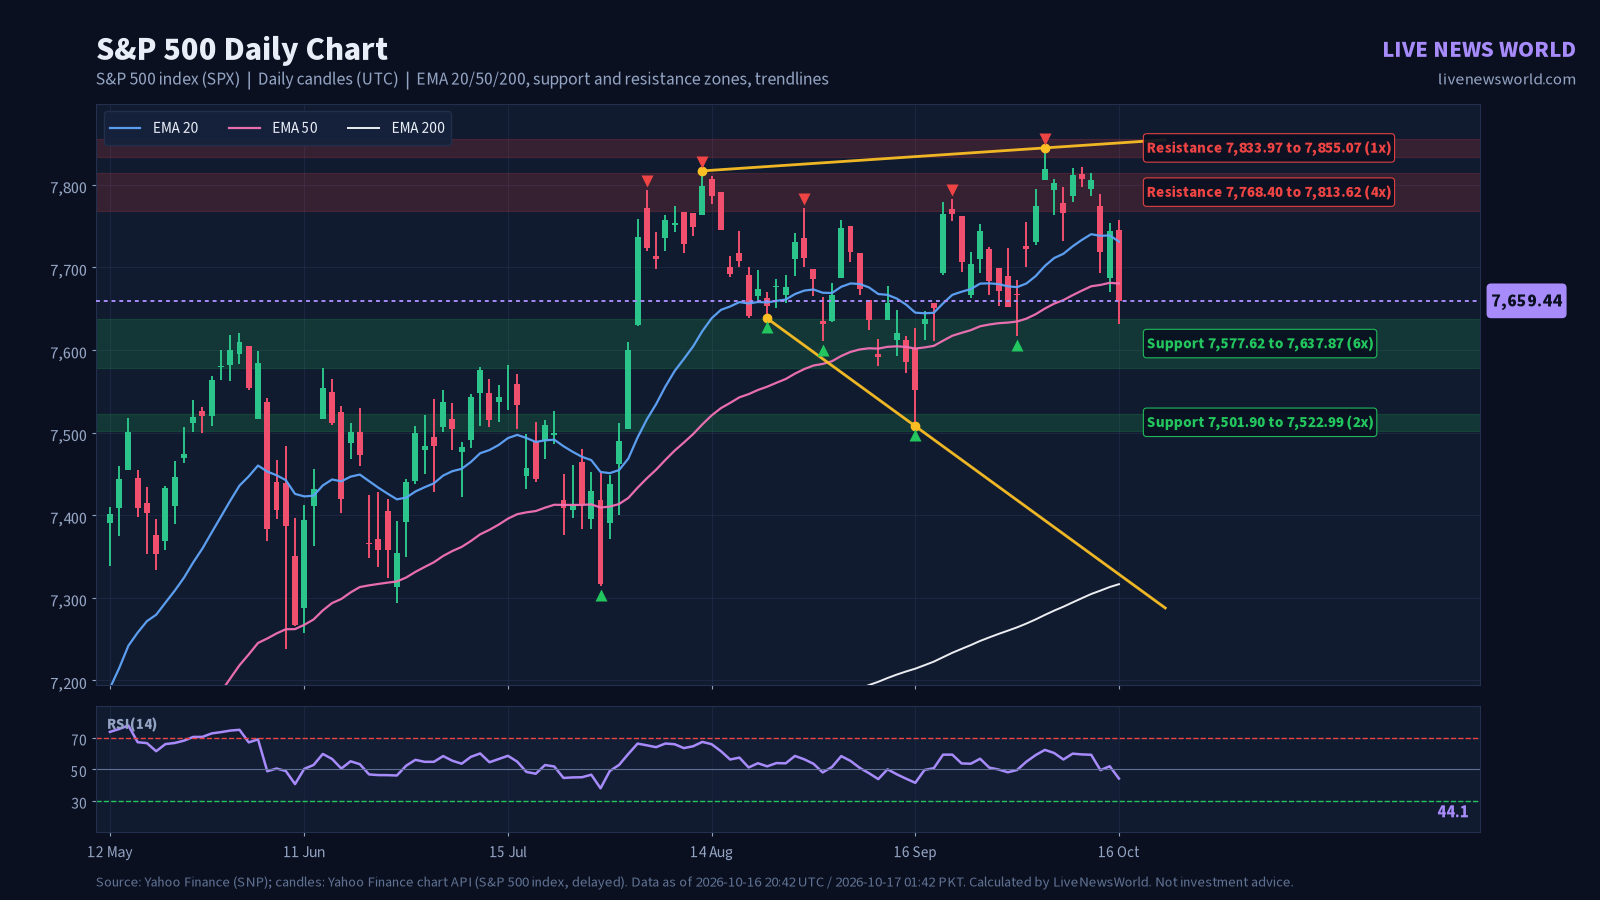
- S&P 500 closed the Friday 16 October session at 7,659.44 (-84.62 points, -1.09%). Daily trend: uptrend, overall bias bearish.
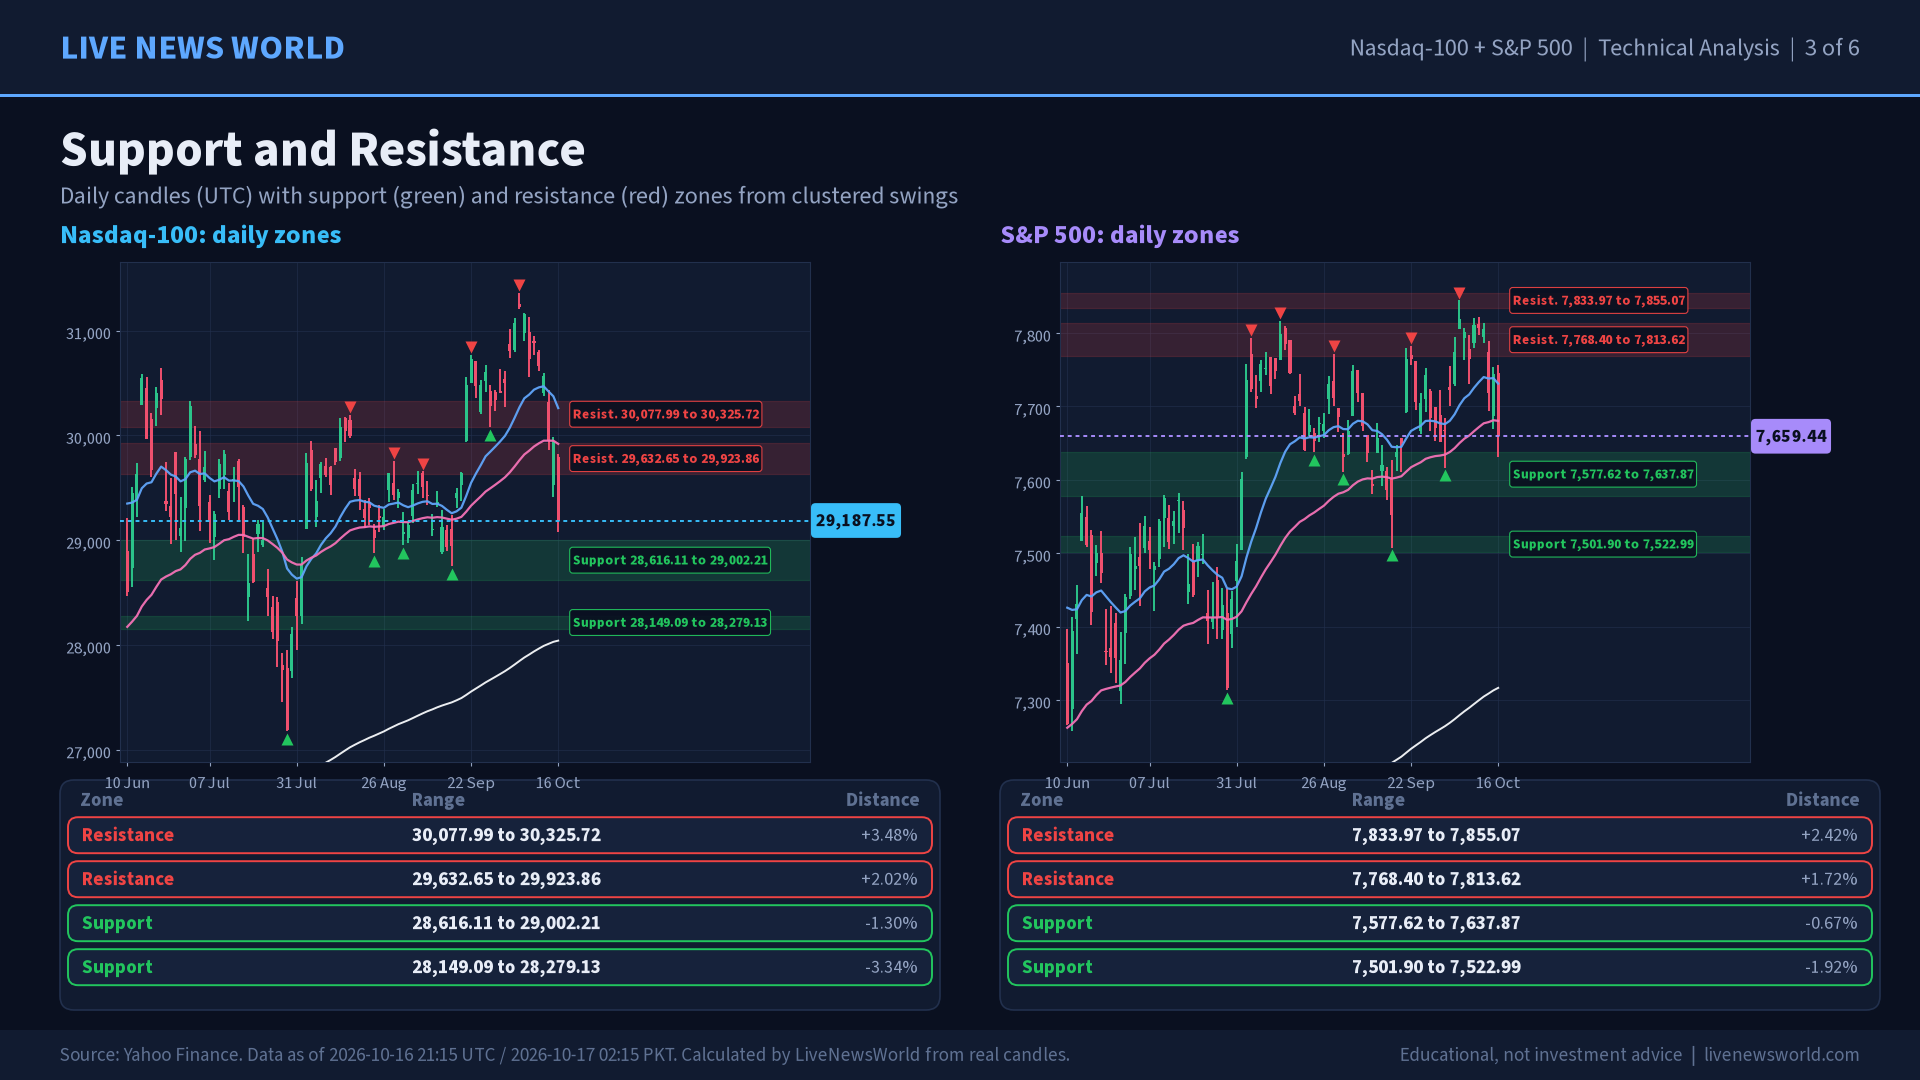
- Nasdaq-100: Nearest daily resistance zone 29,632.65 to 29,923.86; nearest support zone 28,616.11 to 29,002.21.
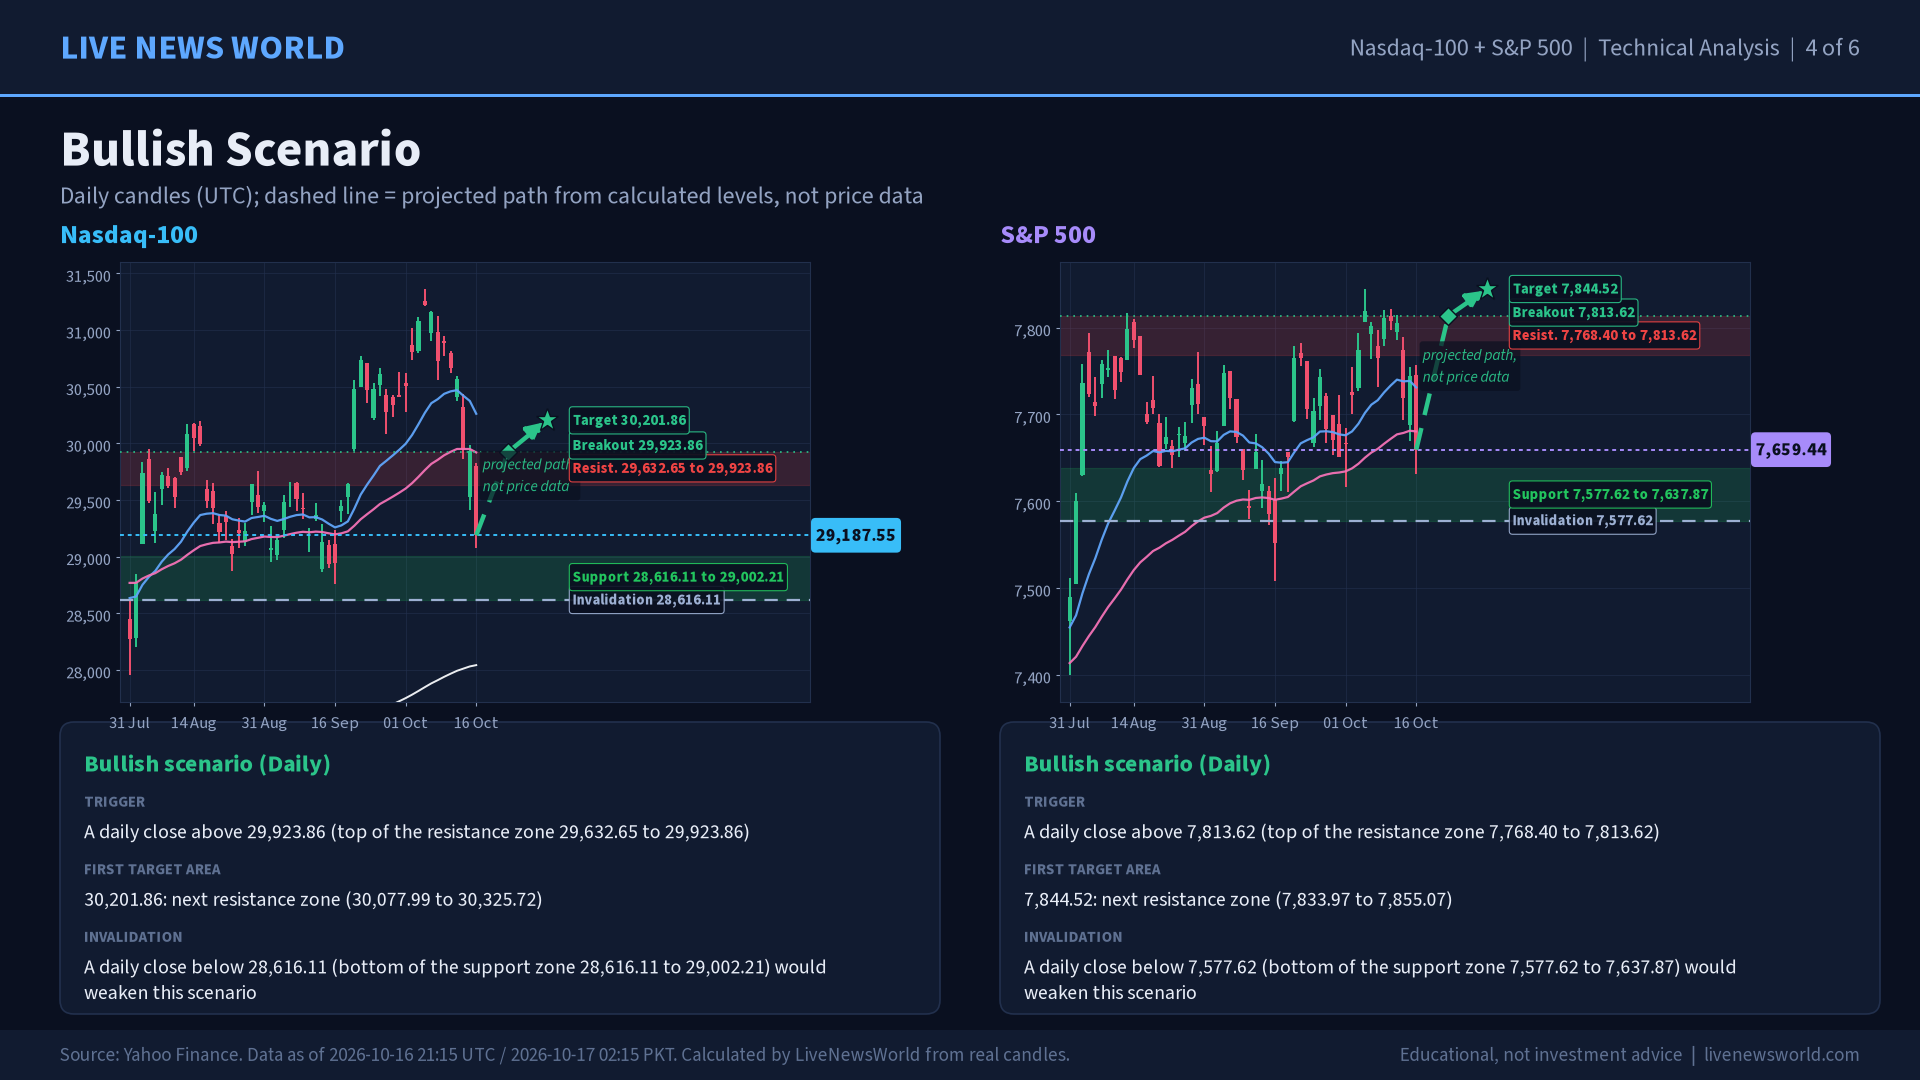
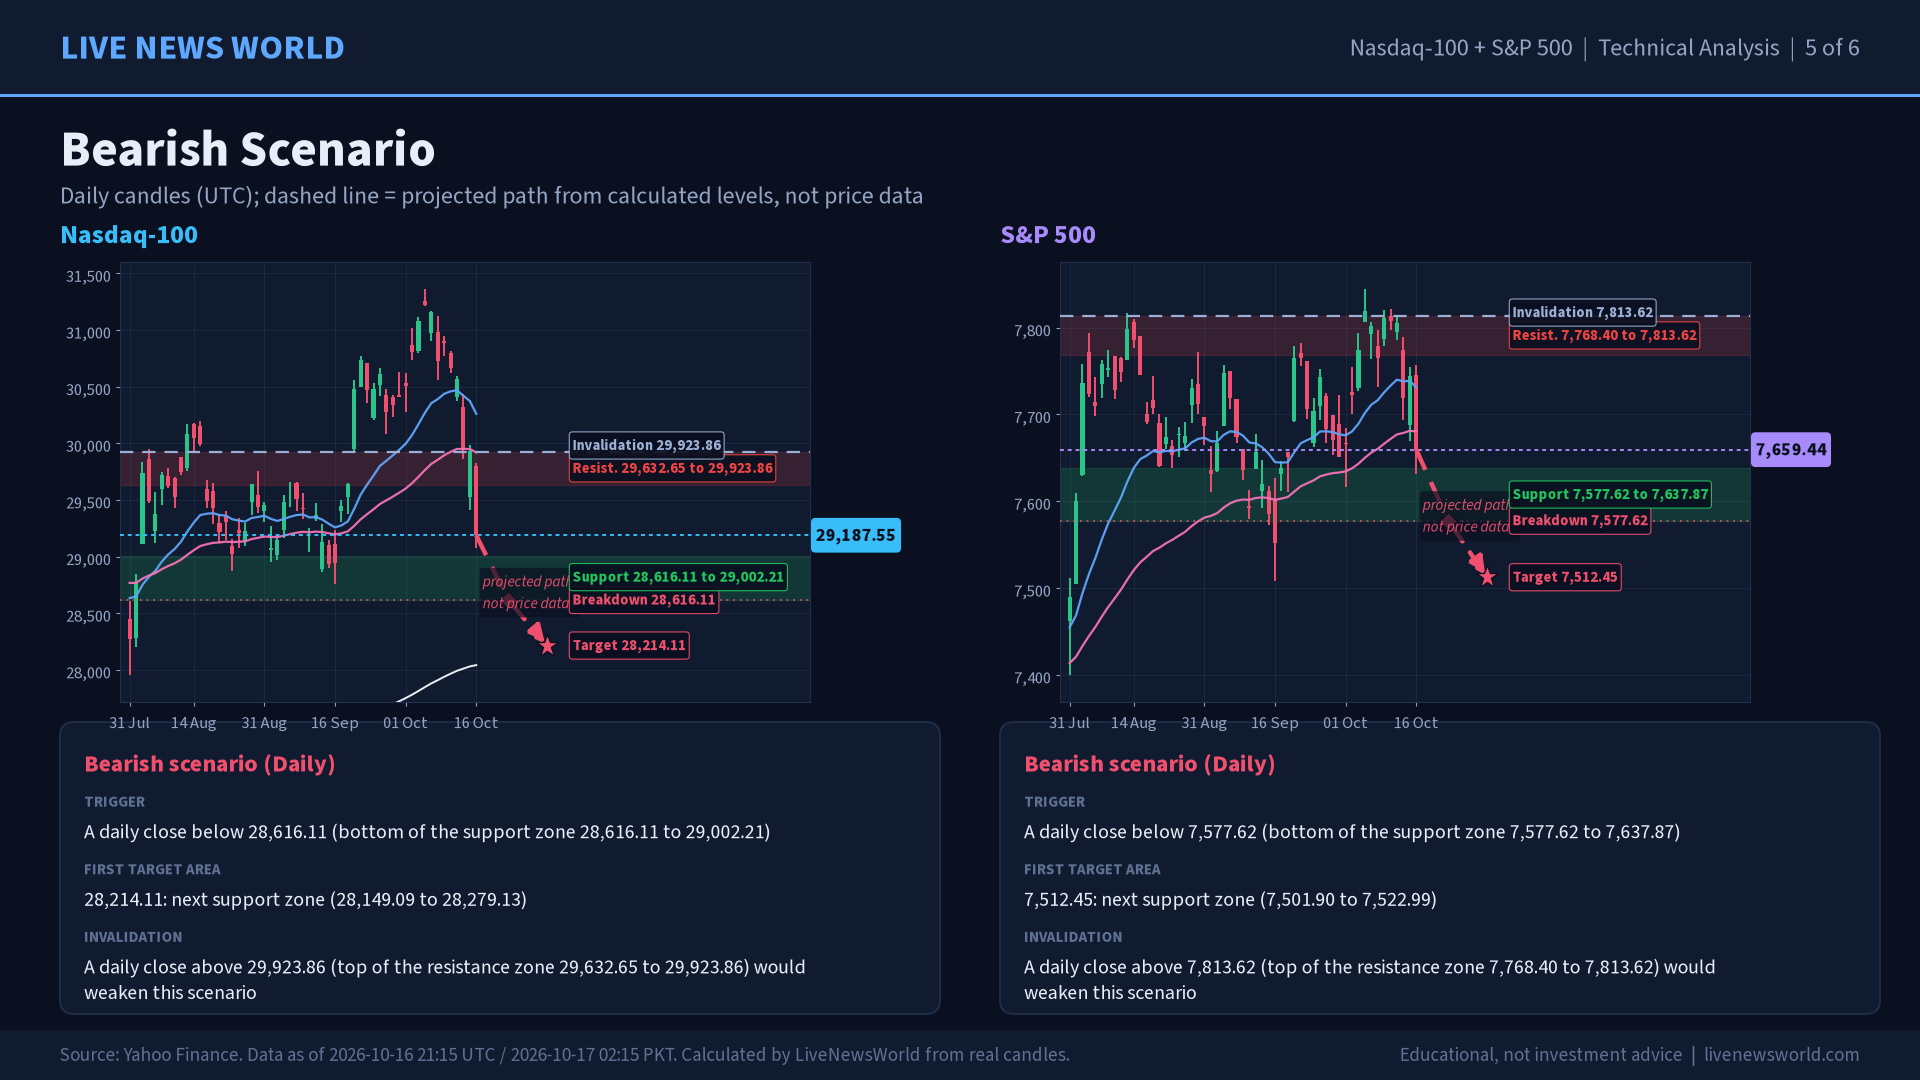
- Nasdaq-100: A daily close above 29,923.86 would open the bullish scenario; a close below 28,616.11 would open the bearish one.
- S&P 500: Nearest daily resistance zone 7,768.40 to 7,813.62; nearest support zone 7,577.62 to 7,637.87.
U.S. stocks head into the week of 19 October after the Friday 16 October session, the latest completed cash session in our data. This outlook reads the Nasdaq-100 and the S&P 500 from real daily and hourly candles, then lists the levels that would change the picture. Prices are index levels delayed by about 15 minutes and were retrieved on 17 Oct 2026, 08:08 UTC / 17 Oct 2026, 13:08 PKT. For live moves, follow Markets Live.
Market Overview
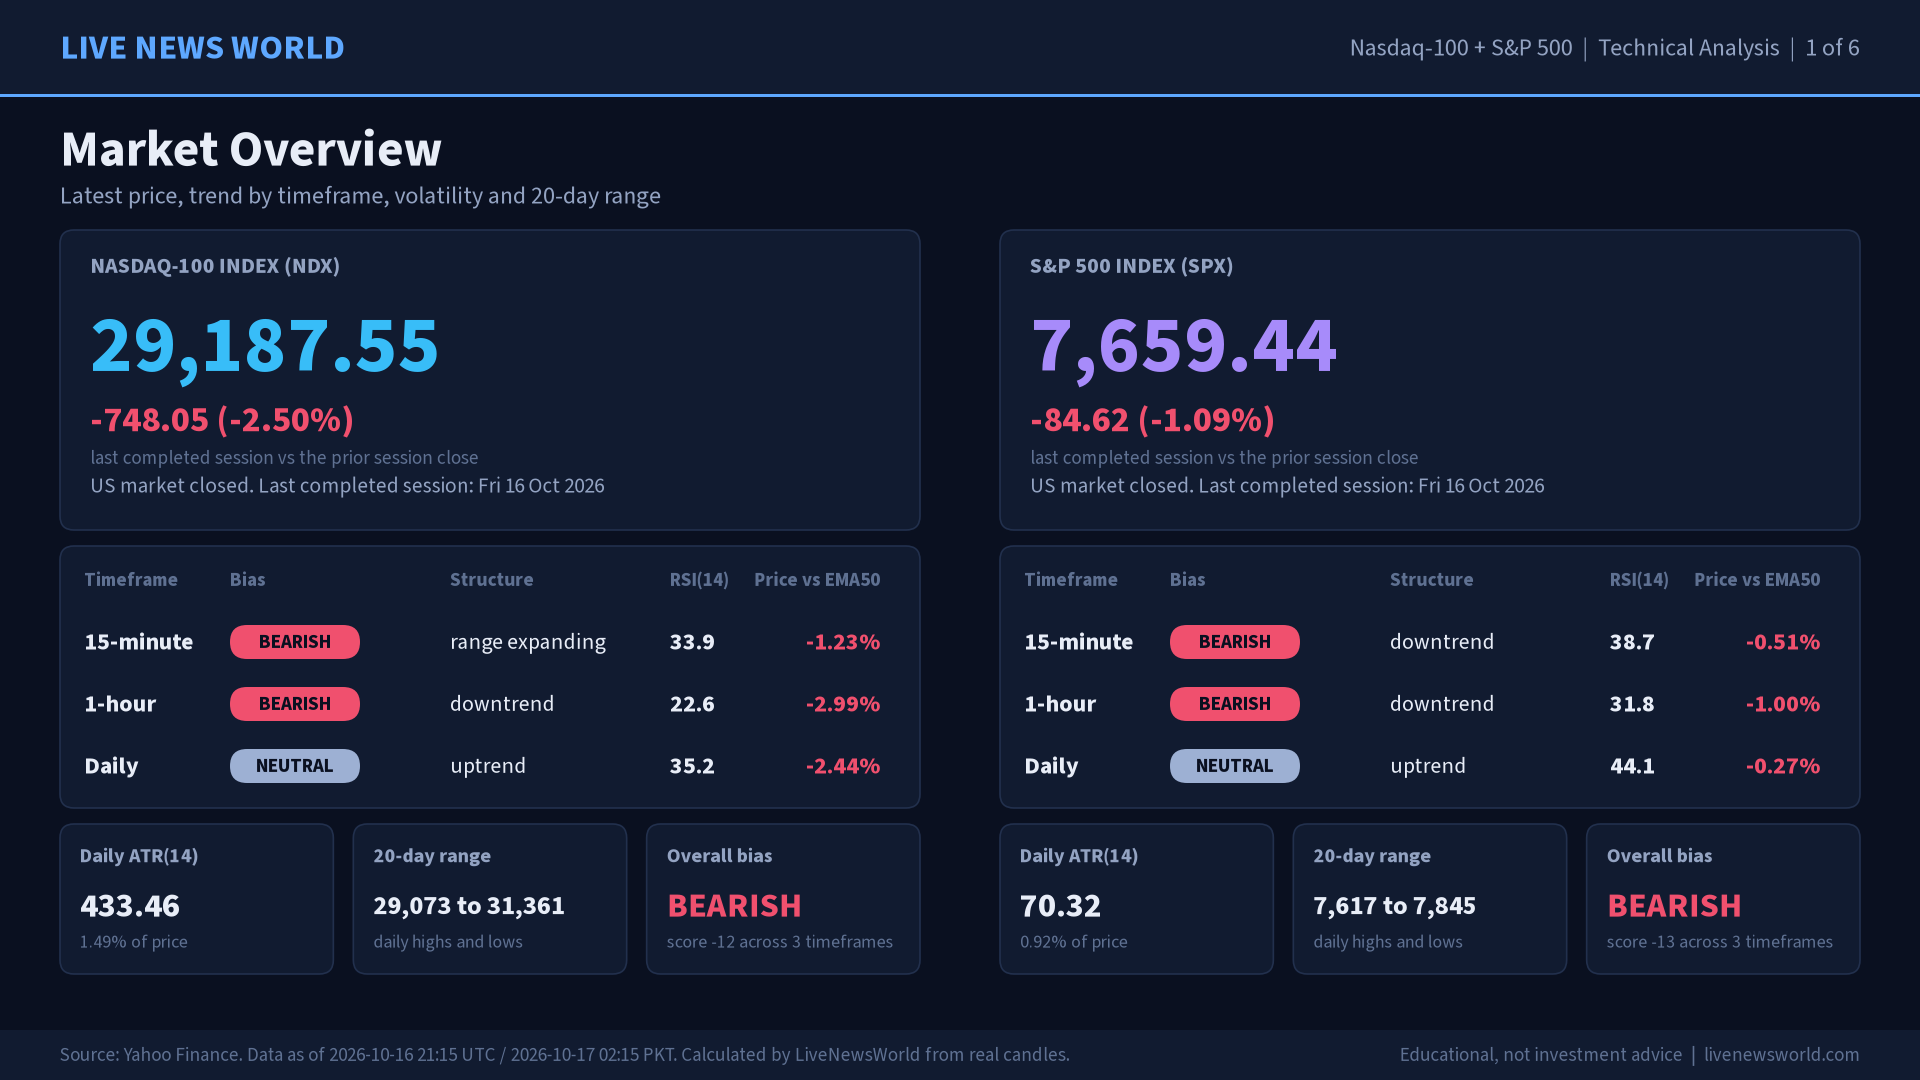
The Nasdaq-100 ended Friday at 29,187.55, down 748.05 points (2.50%) on the session. Over the last 20 daily candles the range runs from 29,073.29 to 31,361.37, and the daily ATR(14) is 433.46 (1.49% of price). Cross-checks matched within tolerance: CNBC .NDX 29,187.55; Nasdaq.com NDX info 29,187.55.
The S&P 500 ended Friday at 7,659.44, down 84.62 points (1.09%) on the session. Over the last 20 daily candles the range runs from 7,616.78 to 7,844.52, and the daily ATR(14) is 70.32 (0.92% of price). Cross-checks matched within tolerance: CNBC .SPX 7,659.44.
Multi-Timeframe Technical Picture
| Timeframe | Bias | Structure | RSI(14) | Price vs EMA 50 |
|---|---|---|---|---|
| Nasdaq-100 1-hour | Bearish | downtrend | 22.6 | -2.99% |
| Nasdaq-100 Daily | Neutral | uptrend | 35.2 | -2.44% |
| S&P 500 1-hour | Bearish | downtrend | 31.8 | -1.00% |
| S&P 500 Daily | Neutral | uptrend | 44.1 | -0.27% |
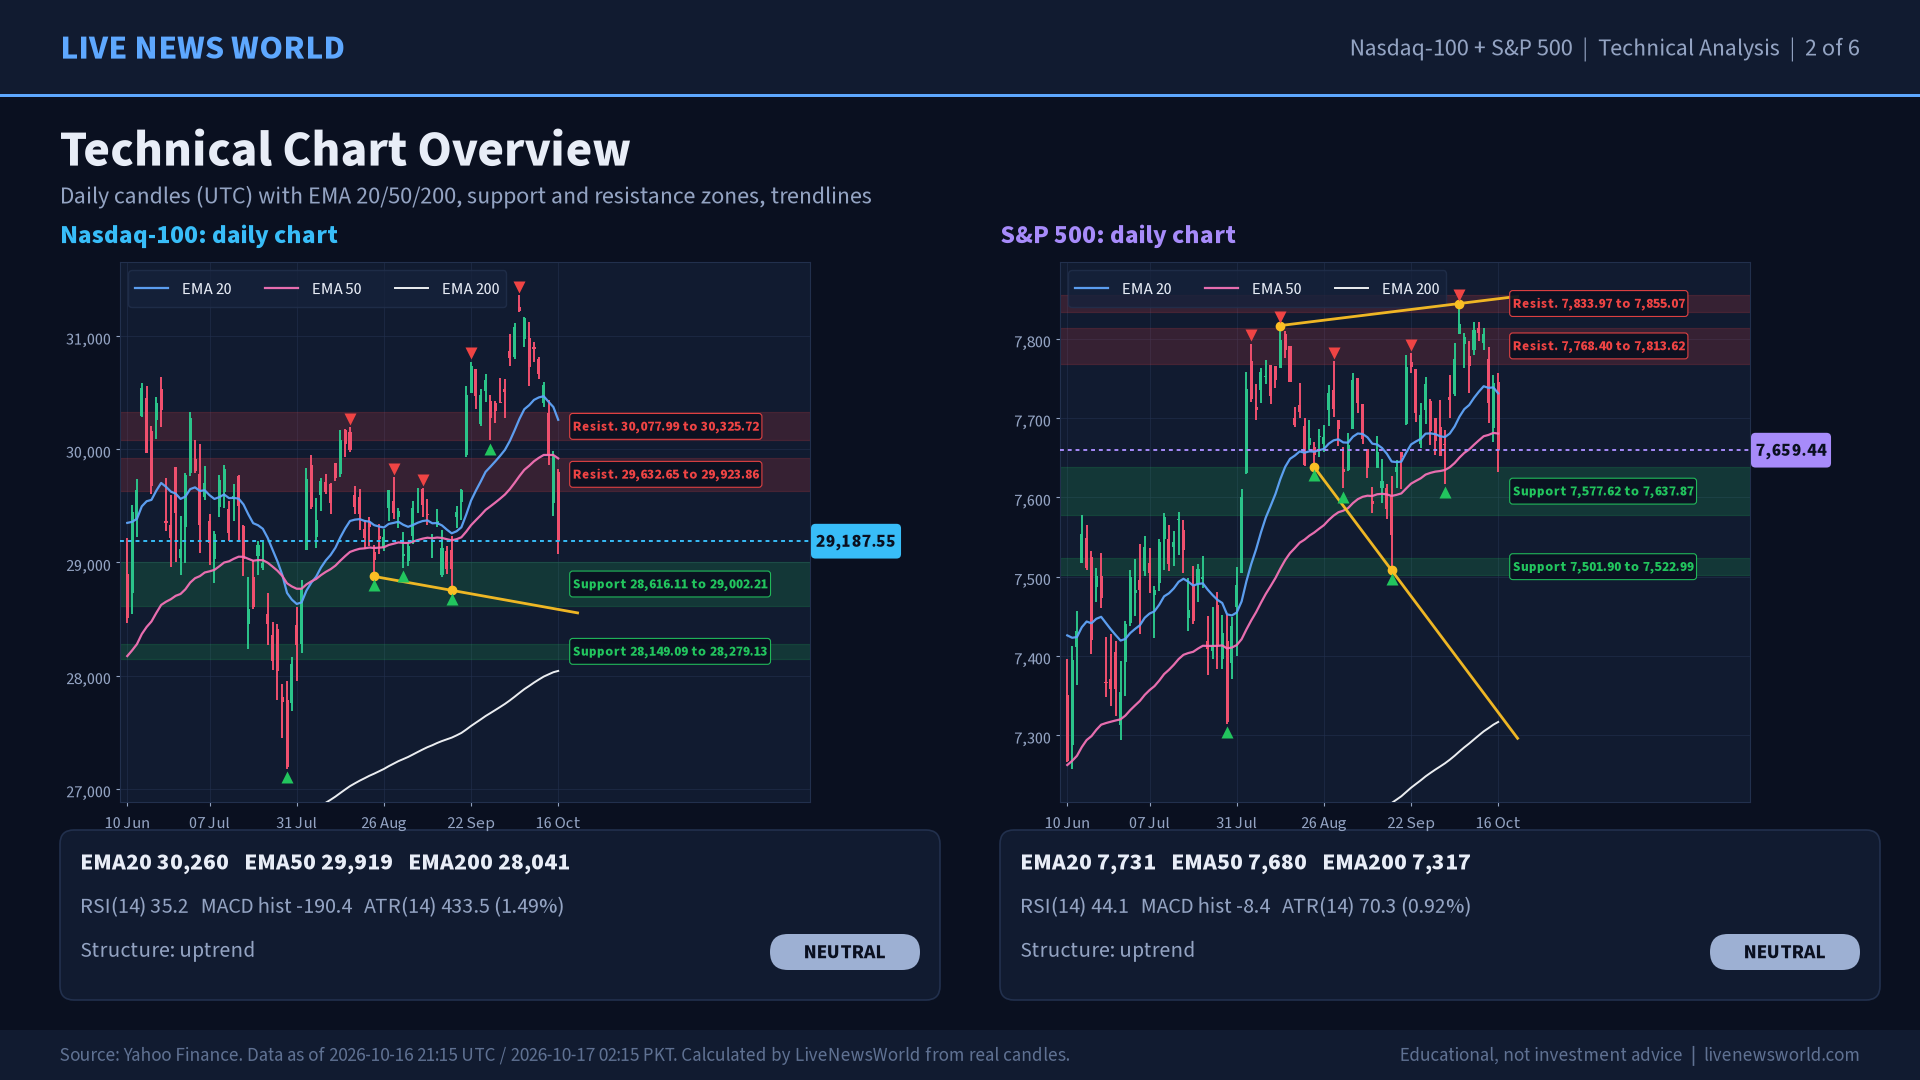
Nasdaq-100, daily. On the daily chart the last completed candle (opened 2026-10-16 13:30 UTC) closed at 29,187.55. That is 3.54% below the 20-period EMA (30,260.20), 2.44% below the 50-period EMA (29,919.00) and 4.09% above the 200-period EMA (28,041.26). Swing structure shows higher swing highs and higher swing lows, which our rules classify as uptrend. RSI(14) is 35.2, below the neutral 50 line. The MACD histogram is -190.35, falling from -123.10 on the previous bar, with the MACD line below its signal line. The ATR(14) is 433.46, or 1.49% of price. Net, the daily timeframe is neutral (score -1).
S&P 500, daily. On the daily chart the last completed candle (opened 2026-10-16 13:30 UTC) closed at 7,659.44. That is 0.93% below the 20-period EMA (7,731.12), 0.27% below the 50-period EMA (7,680.40) and 4.69% above the 200-period EMA (7,316.52). Swing structure shows higher swing highs and higher swing lows, which our rules classify as uptrend. RSI(14) is 44.1, below the neutral 50 line. The MACD histogram is -8.40, falling from -0.78 on the previous bar, with the MACD line below its signal line. The ATR(14) is 70.32, or 0.92% of price. Net, the daily timeframe is neutral (score -1).
Support and Resistance Levels
Nasdaq-100: Daily zones (price 29,187.55). Zones are clusters of swing highs and lows; ‘touches’ counts the swings inside each zone.
| Zone | Range | Touches | Distance from price |
|---|---|---|---|
| Resistance | 30,660.11 to 30,790.15 | 3 | +5.27% |
| Resistance | 30,077.99 to 30,325.72 | 3 | +3.48% |
| Resistance | 29,632.65 to 29,923.86 | 5 | +2.02% |
| Support | 28,616.11 to 29,002.21 | 6 | -1.30% |
| Support | 28,149.09 to 28,279.13 | 2 | -3.34% |
| Support | 25,298.39 to 25,428.42 | 2 | -13.10% |
S&P 500: Daily zones (price 7,659.44). Zones are clusters of swing highs and lows; ‘touches’ counts the swings inside each zone.
| Zone | Range | Touches | Distance from price |
|---|---|---|---|
| Resistance | 7,833.97 to 7,855.07 | 1 | +2.42% |
| Resistance | 7,768.40 to 7,813.62 | 4 | +1.72% |
| Support | 7,577.62 to 7,637.87 | 6 | -0.67% |
| Support | 7,501.90 to 7,522.99 | 2 | -1.92% |
| Support | 7,294.18 to 7,333.68 | 3 | -4.51% |
For reference, the classic daily pivot levels from the last completed daily bar (2026-10-16) are S1 28,899.59, pivot 29,361.25 and R1 29,649.21 for Nasdaq-100.
Bullish, Bearish and Neutral Scenarios
These are conditional scenarios built from the levels above. They are not predictions or trade signals.
Nasdaq-100: Bullish scenario
Trigger: A daily close above 29,923.86 (top of the resistance zone 29,632.65 to 29,923.86). First reference: 30,201.86, the next resistance zone (30,077.99 to 30,325.72). Invalidation: a daily close below 28,616.11 would weaken the idea.
Nasdaq-100: Bearish scenario
Trigger: A daily close below 28,616.11 (bottom of the support zone 28,616.11 to 29,002.21). First reference: 28,214.11, the next support zone (28,149.09 to 28,279.13). Invalidation: a daily close above 29,923.86 would weaken the idea.
Nasdaq-100: Neutral scenario
Condition: Daily closes stay between 28,616.11 and 29,923.86. In that case Nasdaq-100 stays in a range while price keeps rotating between these zone edges without a confirmed close beyond either one. Mixed signals across timeframes (15m bearish, 1h bearish, 1d neutral) support patience until a trigger is hit.
S&P 500: Bullish scenario
Trigger: A daily close above 7,813.62 (top of the resistance zone 7,768.40 to 7,813.62). First reference: 7,844.52, the next resistance zone (7,833.97 to 7,855.07). Invalidation: a daily close below 7,577.62 would weaken the idea.
S&P 500: Bearish scenario
Trigger: A daily close below 7,577.62 (bottom of the support zone 7,577.62 to 7,637.87). First reference: 7,512.45, the next support zone (7,501.90 to 7,522.99). Invalidation: a daily close above 7,813.62 would weaken the idea.
S&P 500: Neutral scenario
Condition: Daily closes stay between 7,577.62 and 7,813.62. In that case S&P 500 stays in a range while price keeps rotating between these zone edges without a confirmed close beyond either one. Mixed signals across timeframes (15m bearish, 1h bearish, 1d neutral) support patience until a trigger is hit.
What to Watch Next
Index levels can react to earnings, economic data and Treasury yields; see the 10-year Treasury yield explainer and our earlier Nasdaq-100 forecast for background.
Scheduled items in the next two weeks:
- The Federal Reserve FOMC meeting (27 and 28 October), 27 October.
Reference pages: Nasdaq-100 index quote page and Federal Reserve FOMC calendar.
Sources and Data Notes
Data sources: Yahoo Finance chart API (Nasdaq-100 index, delayed); CNBC .NDX; CNBC .SPX; Nasdaq.com NDX info. Index levels from Yahoo Finance (delayed, unofficial) cross-checked against CNBC and Nasdaq. Indicators, zones and scenarios are LiveNewsWorld calculations. Yahoo Finance data are delayed and unofficial.
This article is for informational and educational purposes only and does not constitute personalized financial or investment advice. Market conditions can change rapidly.