Key Points
- The Nasdaq-100 fell 618.66 points, or 2.02%, to 29,950.82 on Wednesday, 14 October 2026, its biggest one-day drop since 29 July, as a hotter inflation report and an AI-stock sell-off hit technology.
- The Bureau of Labor Statistics reported consumer prices up 0.6% in September and 3.7% over 12 months; gasoline rose 9.1% and made up over half of the monthly gain.
- The index closed 1.87% below its 20-day average (30,522.61) and 0.29% above its 50-day average (29,862.76); RSI is 44.6 and MACD momentum is negative.
- Next catalysts: producer prices and retail sales on 15 October, Meta and Tesla earnings on 21 October, the Fed meeting on 27 and 28 October and GDP on 29 October.
The Nasdaq-100 closed Wednesday at 29,950.82, down 2.02%, after a hotter September consumer price report revived talk of further Federal Reserve tightening and chip and AI stocks sold off. The index now sits just above its 50-day average. This outlook uses the 14 October close; U.S. stocks reopen Thursday at 9:30 a.m. ET (6:30 p.m. PKT).
Market Overview
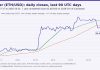
The Nasdaq-100 (NDX) ended the 14 October session at 29,950.82, a loss of 618.66 points, or 2.02%. The session ranged from 29,861.06 to 30,436.60, figures that match Nasdaq’s own index data. It was the index’s largest one-day drop since 29 July in our data. For comparison, the Associated Press reported the S&P 500 fell 1.11% to 7,718.94, the Nasdaq composite fell 1.88% and the Dow Jones Industrial Average slipped 0.09%.
The index set its latest closing high of 31,224.47 on 6 October, with an intraday peak of 31,361.37, and Wednesday’s close is 4.08% below that closing high. The 20-session range runs from 29,305.90 (17 September low) to 31,361.37.
Data note: daily bars from Yahoo Finance (delayed, unofficial) through the 14 October close, cross-checked against Nasdaq Global Indexes. Averages, RSI, MACD and pivots are LiveNewsWorld calculations.
Fundamental Analysis
What the data show
- The Bureau of Labor Statistics reported that the Consumer Price Index rose 0.6% in September on a seasonally adjusted basis after a 0.4% rise in August, and 3.7% over the past 12 months, up from 3.4% in the year to August.
- Gasoline rose 9.1% in September and accounted for over half of the monthly increase. The energy index is up 20.4% from a year earlier.
- The core index, which excludes food and energy, rose 0.3% on the month, the same as in August, and 2.6% over 12 months, up from 2.4%.
- The Treasury 10-year par yield ended the day at 5.19%, 2 basis points below Tuesday’s 5.21%, while the 2-year yield rose to 4.82% from 4.79%.
- The ICE U.S. Dollar Index rose 0.38% to its highest level in more than a year, MarketWatch reported.
Our interpretation
The report was energy-led, but the core reading did not cool and the annual rate moved higher. Several outlets reported that market-implied odds of a Fed rate increase this month rose after the release. Published probabilities differ by source and time of day, so we do not quote a single figure. For background, see our report on the September FOMC minutes.
Yields jumped after the release and then eased, and the 10-year finished lower on the day. That suggests the equity decline was not only a rate story. AP attributed the heaviest selling to artificial intelligence stocks, consistent with the Nasdaq-100 falling about 1.8 times as much as the S&P 500. Our explainer on the 10-year Treasury yield covers why that rate matters for growth stocks.
Technical Analysis
- 20-day simple average: 30,522.61. The close is 1.87% below it.
- 50-day simple average: 29,862.76. The close is 0.29% above it.
- 200-day simple average: 27,697.31. The close is 8.14% above it, so the longer trend remains upward.
- 14-day RSI: 44.6, below the neutral midpoint of 50 but not oversold.
- MACD (12, 26, 9): the MACD line is 248.42 and the signal line 334.51, a histogram of -86.09. The histogram has fallen from +86.80 on 5 October and turned negative on 13 October, a sign of fading upward momentum.
- Classic pivot from the 14 October bar: pivot 30,082.82, first resistance 30,304.59, second resistance 30,658.36, first support 29,729.05, second support 29,507.29.
Wednesday’s low of 29,861.06 sits within 2 points of the 50-day average, making 29,862 the key line below the market. Above it, the daily pivot and the 20-day average are the nearest references.
Scenarios
Bullish case. If the index recovers above the daily pivot at 30,082.82 and then the 20-day average near 30,523, first resistance at 30,304.59 would be cleared on the way, and the 6 October closing high of 31,224.47 could come into focus.
Bearish case. If the index closes below the 50-day average near 29,863 and Wednesday’s low, first support at 29,729.05 and second support at 29,507.29 could come into focus, followed by the 17 September low of 29,305.90.
Neutral case. If the index keeps closing between roughly 29,863 and 30,083 while RSI stays in the 40s, the market is digesting the inflation report ahead of the Fed.
Key Levels
| Level | Value | Basis |
|---|---|---|
| 20-session high | 31,361.37 | Intraday high, 6 October |
| Closing high | 31,224.47 | Close, 6 October |
| Pivot resistance R2 | 30,658.36 | Classic pivot, 14 October bar |
| 20-day average | 30,522.61 | Simple average of closes |
| Pivot resistance R1 | 30,304.59 | Classic pivot, 14 October bar |
| Daily pivot | 30,082.82 | Classic pivot, 14 October bar |
| 50-day average | 29,862.76 | Simple average of closes |
| 14 October low | 29,861.06 | Intraday low |
| Pivot support S1 | 29,729.05 | Classic pivot, 14 October bar |
| Pivot support S2 | 29,507.29 | Classic pivot, 14 October bar |
| 20-session low | 29,305.90 | Intraday low, 17 September |
| 200-day average | 27,697.31 | Simple average of closes |
Events to Watch
- Thursday 15 October, 8:30 a.m. ET (5:30 p.m. PKT): September producer price index, retail sales and weekly jobless claims, according to the Schwab and Morningstar calendars. TSMC, a key chip supplier, reports before the open.
- Tuesday 20 and Wednesday 21 October: Netflix reports on the 20th and Meta and Tesla on the 21st, per Schwab’s calendar. All three are Nasdaq-100 members.
- Tuesday 27 and Wednesday 28 October: Federal Open Market Committee meeting, per the Federal Reserve’s 2026 calendar.
- Thursday 29 October, 8:30 a.m. ET (5:30 p.m. PKT): third-quarter GDP advance estimate and September personal income and outlays, per the Bureau of Economic Analysis.
- Tuesday 10 November, 8:30 a.m. ET (6:30 p.m. PKT): October CPI, per the Bureau of Labor Statistics. U.S. clocks move back on 1 November, which shifts PKT times by one hour.
Follow the day’s price action on our Markets Live page. For earlier background, see our May Nasdaq analysis, which predates the current range.
Final Outlook
The technical picture has weakened: the index closed below its 20-day average, RSI is in the mid-40s and MACD momentum is negative, while the 50-day average is holding by a thin margin and the 200-day average still slopes upward. Inflation data have complicated the case for lower rates, and the Fed meeting on 27 and 28 October is the next major decision point. Our working view is cautious while the index stays below 30,522.61. That view would be invalidated by a daily close above the 20-day average at 30,522.61, which it lost on Wednesday.
This article is for informational and educational purposes only and does not constitute personalized financial or investment advice. Market conditions can change rapidly.
Sources
- U.S. Bureau of Labor Statistics, Consumer Price Index Summary, September 2026
- Federal Reserve Board, FOMC meeting calendars
- Nasdaq Global Indexes, NASDAQ-100 (NDX) history, data as of 14 October 2026
- Associated Press and MarketWatch, U.S. market close reports, 14 October 2026
- U.S. Department of the Treasury daily par yield curve rates; Bureau of Economic Analysis release schedule; Charles Schwab and Morningstar weekly market calendars