Six-Slide Visual Analysis
Key Points
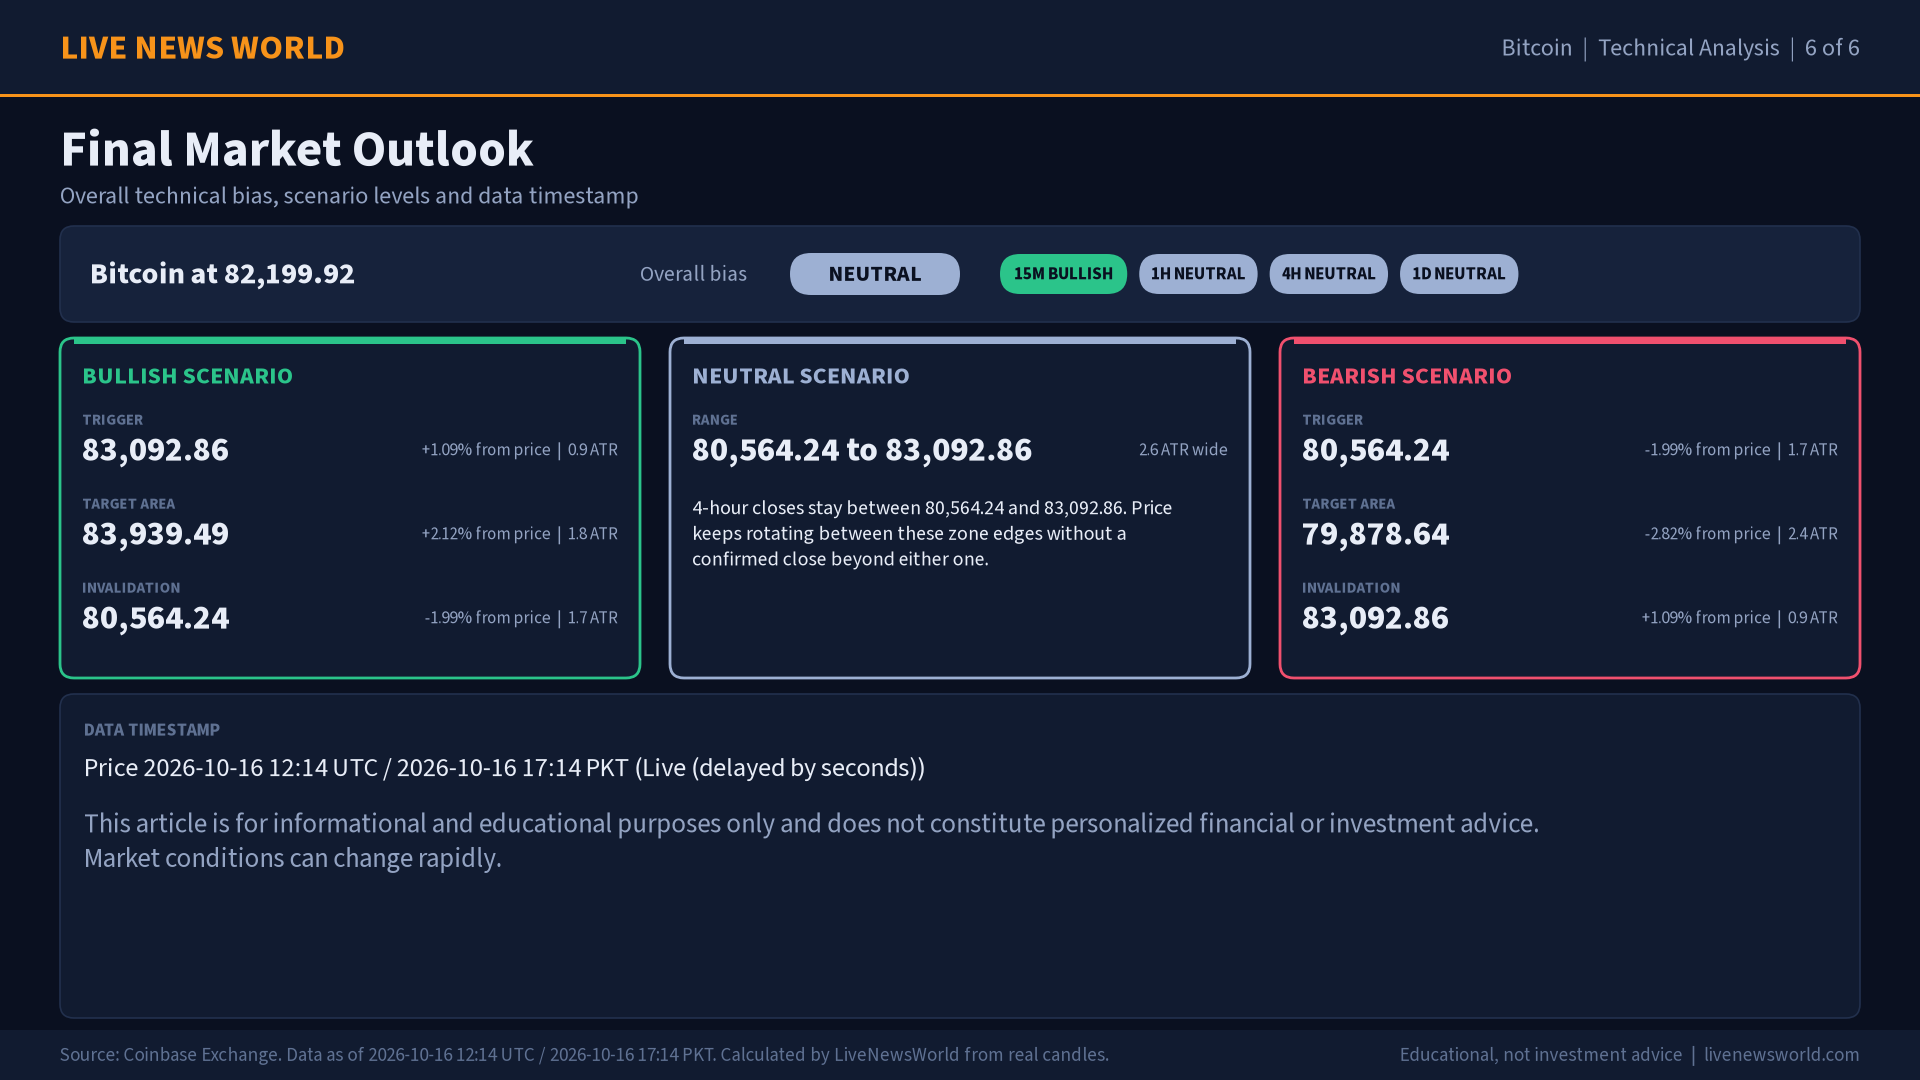
- Bitcoin traded at 82,199.92 at 16 Oct 2026, 12:14 UTC (17:14 PKT), +0.08% versus the last completed daily close. Overall bias across four timeframes: neutral (score +4).
- Nearest 4-hour resistance zone 82,496.20 to 83,092.86; nearest support zone 80,564.24 to 80,927.48.
- A 4-hour close above 83,092.86 would open the bullish scenario; a close below 80,564.24 would open the bearish one.
Bitcoin is trading near 82,199.92 as of 16 Oct 2026, 12:14 UTC (17:14 PKT). The market is open. This analysis reads real Bitcoin spot (Coinbase BTC-USD) candles on four timeframes (15-minute, 1-hour, 4-hour and daily), calculates support and resistance from swing points, and sets out three scenarios with exact trigger and invalidation levels. For live moves, follow Markets Live.
Market Overview
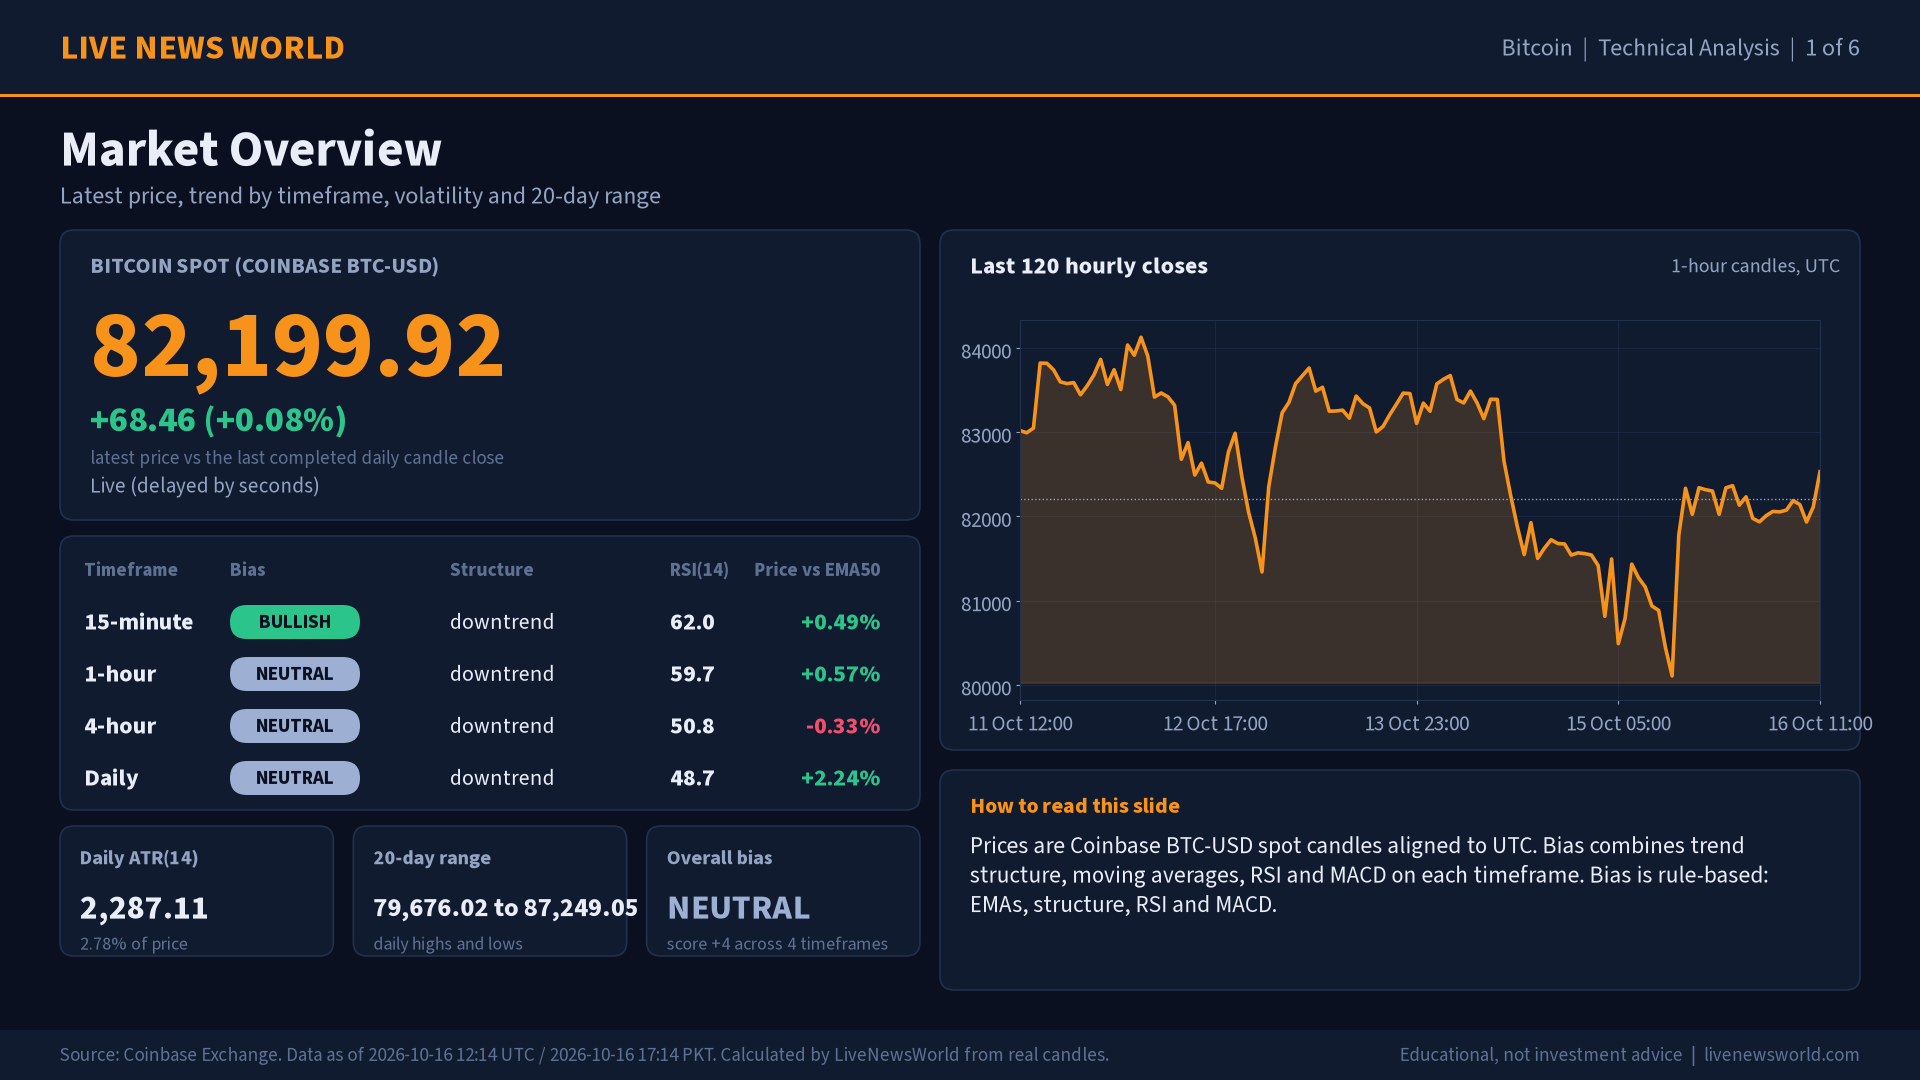
Bitcoin traded at 82,199.92, up 0.08% from the last completed daily close. The latest quote comes from Coinbase Exchange ticker (BTC-USD); status: live (delayed by seconds). Over the last 20 daily candles the range runs from 79,676.02 to 87,249.05, and the daily ATR(14) is 2,287.11 (2.78% of price), so a typical daily candle spans roughly that distance. Independent checks agree with the quote: Kraken XBT/USD ticker 82,196.10; Bitstamp BTC/USD ticker 82,199.60; CNBC BTC= 82,224.47; Kraken daily candle (completed UTC day 2026-10-15) 82,133.70.
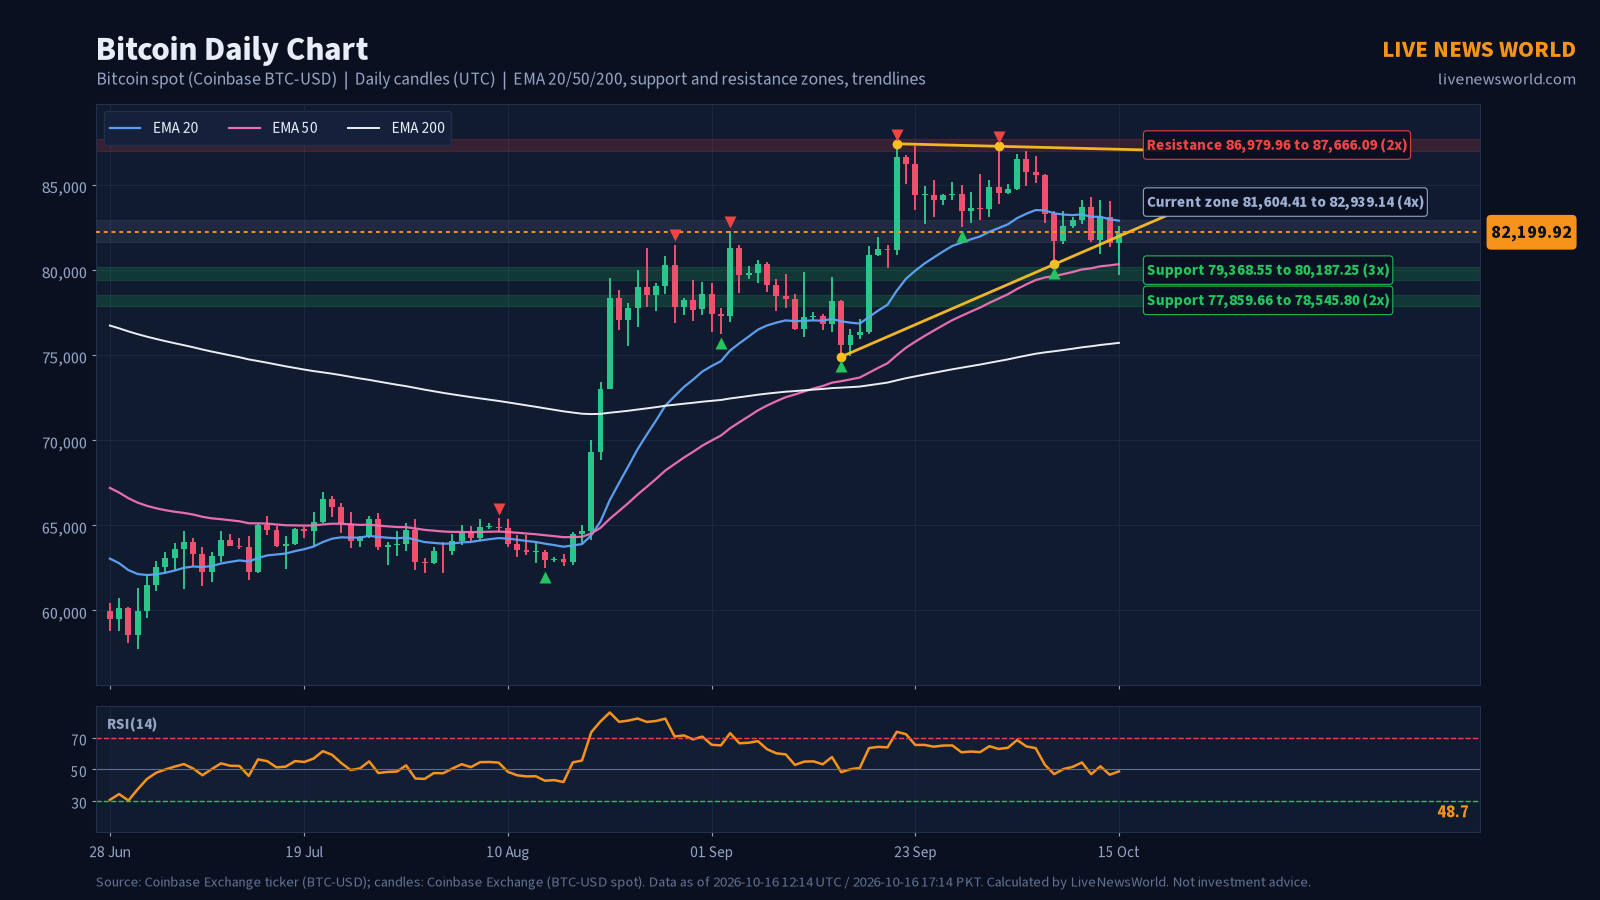
Multi-Timeframe Technical Picture
| Timeframe | Bias | Structure | RSI(14) | Price vs EMA 50 |
|---|---|---|---|---|
| 15-minute | Bullish | downtrend | 62.0 | +0.49% |
| 1-hour | Neutral | downtrend | 59.7 | +0.57% |
| 4-hour | Neutral | downtrend | 50.8 | -0.33% |
| Daily | Neutral | downtrend | 48.7 | +2.24% |
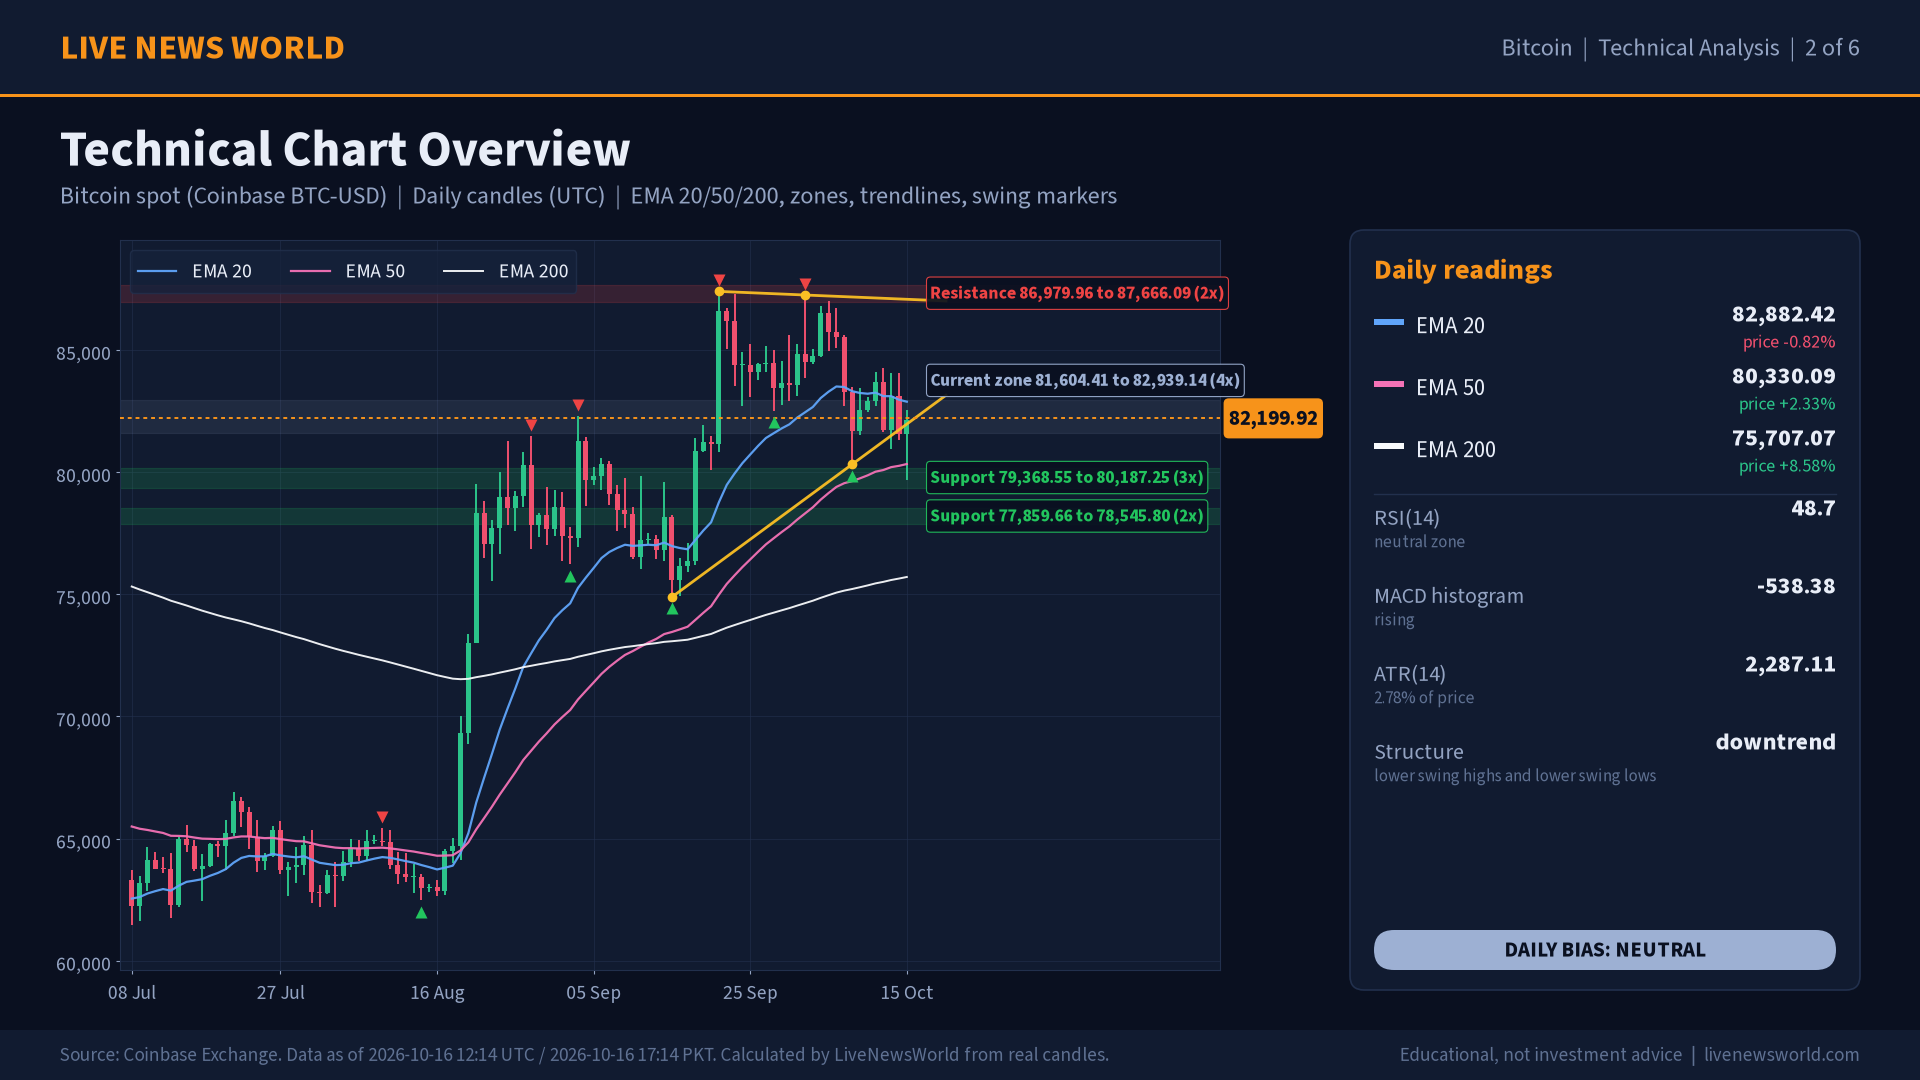
Daily timeframe. On the daily chart the last completed candle (opened 2026-10-15 00:00 UTC) closed at 82,131.46. That is 0.91% below the 20-period EMA (82,882.42), 2.24% above the 50-period EMA (80,330.09) and 8.49% above the 200-period EMA (75,707.07). Swing structure shows lower swing highs and lower swing lows, which our rules classify as downtrend. RSI(14) is 48.7, below the neutral 50 line. The MACD histogram is -538.38, rising from -568.15 on the previous bar, with the MACD line below its signal line. The ATR(14) is 2,287.11, or 2.78% of price. Net, the daily timeframe is neutral (score -1).
4-hour timeframe. On the 4-hour chart the last completed candle (opened 2026-10-16 08:00 UTC) closed at 82,528.99. That is 0.27% above the 20-period EMA (82,309.37), 0.33% below the 50-period EMA (82,799.74) and 0.66% above the 200-period EMA (81,985.51). Swing structure shows lower swing highs and lower swing lows, which our rules classify as downtrend. RSI(14) is 50.8, above the neutral 50 line. The MACD histogram is +63.16, rising from +21.49 on the previous bar, with the MACD line above its signal line. The ATR(14) is 983.00, or 1.19% of price. Net, the 4-hour timeframe is neutral (score -1).
1-hour timeframe. On the 1-hour chart the last completed candle (opened 2026-10-16 11:00 UTC) closed at 82,528.99. That is 0.59% above the 20-period EMA (82,044.60), 0.57% above the 50-period EMA (82,062.30) and 0.28% below the 200-period EMA (82,758.64). Swing structure shows lower swing highs and lower swing lows, which our rules classify as downtrend. RSI(14) is 59.7, above the neutral 50 line. The MACD histogram is +22.21, rising from -4.00 on the previous bar, with the MACD line above its signal line. The ATR(14) is 456.80, or 0.55% of price. Net, the 1-hour timeframe is neutral (score +1).
15-minute timeframe. On the 15-minute chart the last completed candle (opened 2026-10-16 11:45 UTC) closed at 82,528.99. That is 0.36% above the 20-period EMA (82,234.38), 0.49% above the 50-period EMA (82,123.52) and 0.56% above the 200-period EMA (82,070.10). Swing structure shows lower swing highs and lower swing lows, which our rules classify as downtrend. RSI(14) is 62.0, above the neutral 50 line. The MACD histogram is +64.12, falling from +67.40 on the previous bar, with the MACD line above its signal line. The ATR(14) is 201.80, or 0.24% of price. Net, the 15-minute timeframe leans bullish (score +5).
Support and Resistance Levels
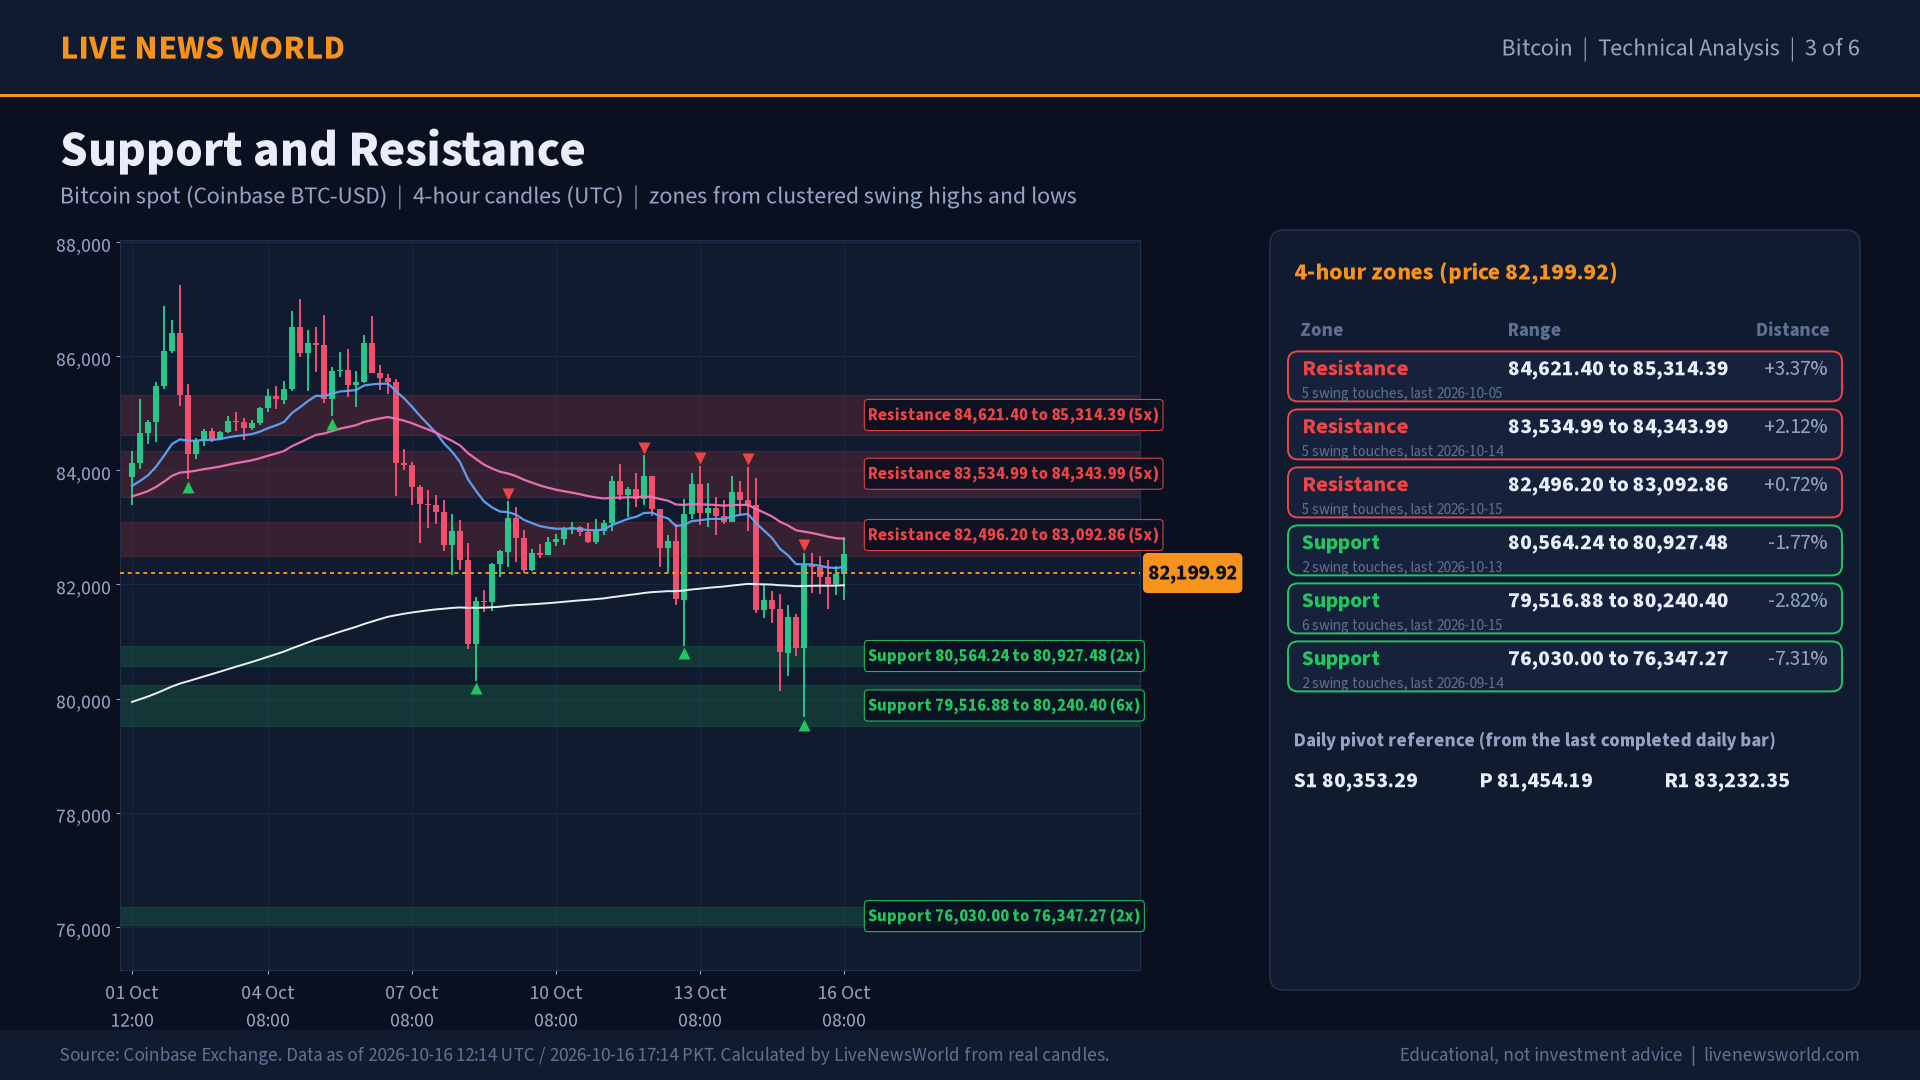
4-hour zones (price 82,199.92). Zones are clusters of swing highs and lows; ‘touches’ counts the swings inside each zone.
| Zone | Range | Touches | Distance from price |
|---|---|---|---|
| Resistance | 84,621.40 to 85,314.39 | 5 | +3.37% |
| Resistance | 83,534.99 to 84,343.99 | 5 | +2.12% |
| Resistance | 82,496.20 to 83,092.86 | 5 | +0.72% |
| Support | 80,564.24 to 80,927.48 | 2 | -1.77% |
| Support | 79,516.88 to 80,240.40 | 6 | -2.82% |
| Support | 76,030.00 to 76,347.27 | 2 | -7.31% |
Daily zones (price 82,199.92). Zones are clusters of swing highs and lows; ‘touches’ counts the swings inside each zone.
| Zone | Range | Touches | Distance from price |
|---|---|---|---|
| Resistance | 86,979.96 to 87,666.09 | 2 | +6.23% |
| Price zone | 81,604.41 to 82,939.14 | 4 | inside |
| Support | 79,368.55 to 80,187.25 | 3 | -2.95% |
| Support | 77,859.66 to 78,545.80 | 2 | -4.86% |
| Support | 74,557.68 to 75,243.82 | 2 | -8.88% |
For reference, the classic daily pivot levels from the last completed daily bar (2026-10-15) are S1 80,353.29, pivot 81,454.19 and R1 83,232.35.
Bullish, Bearish and Neutral Scenarios
These are conditional scenarios built from the levels above. They are not predictions or trade signals.
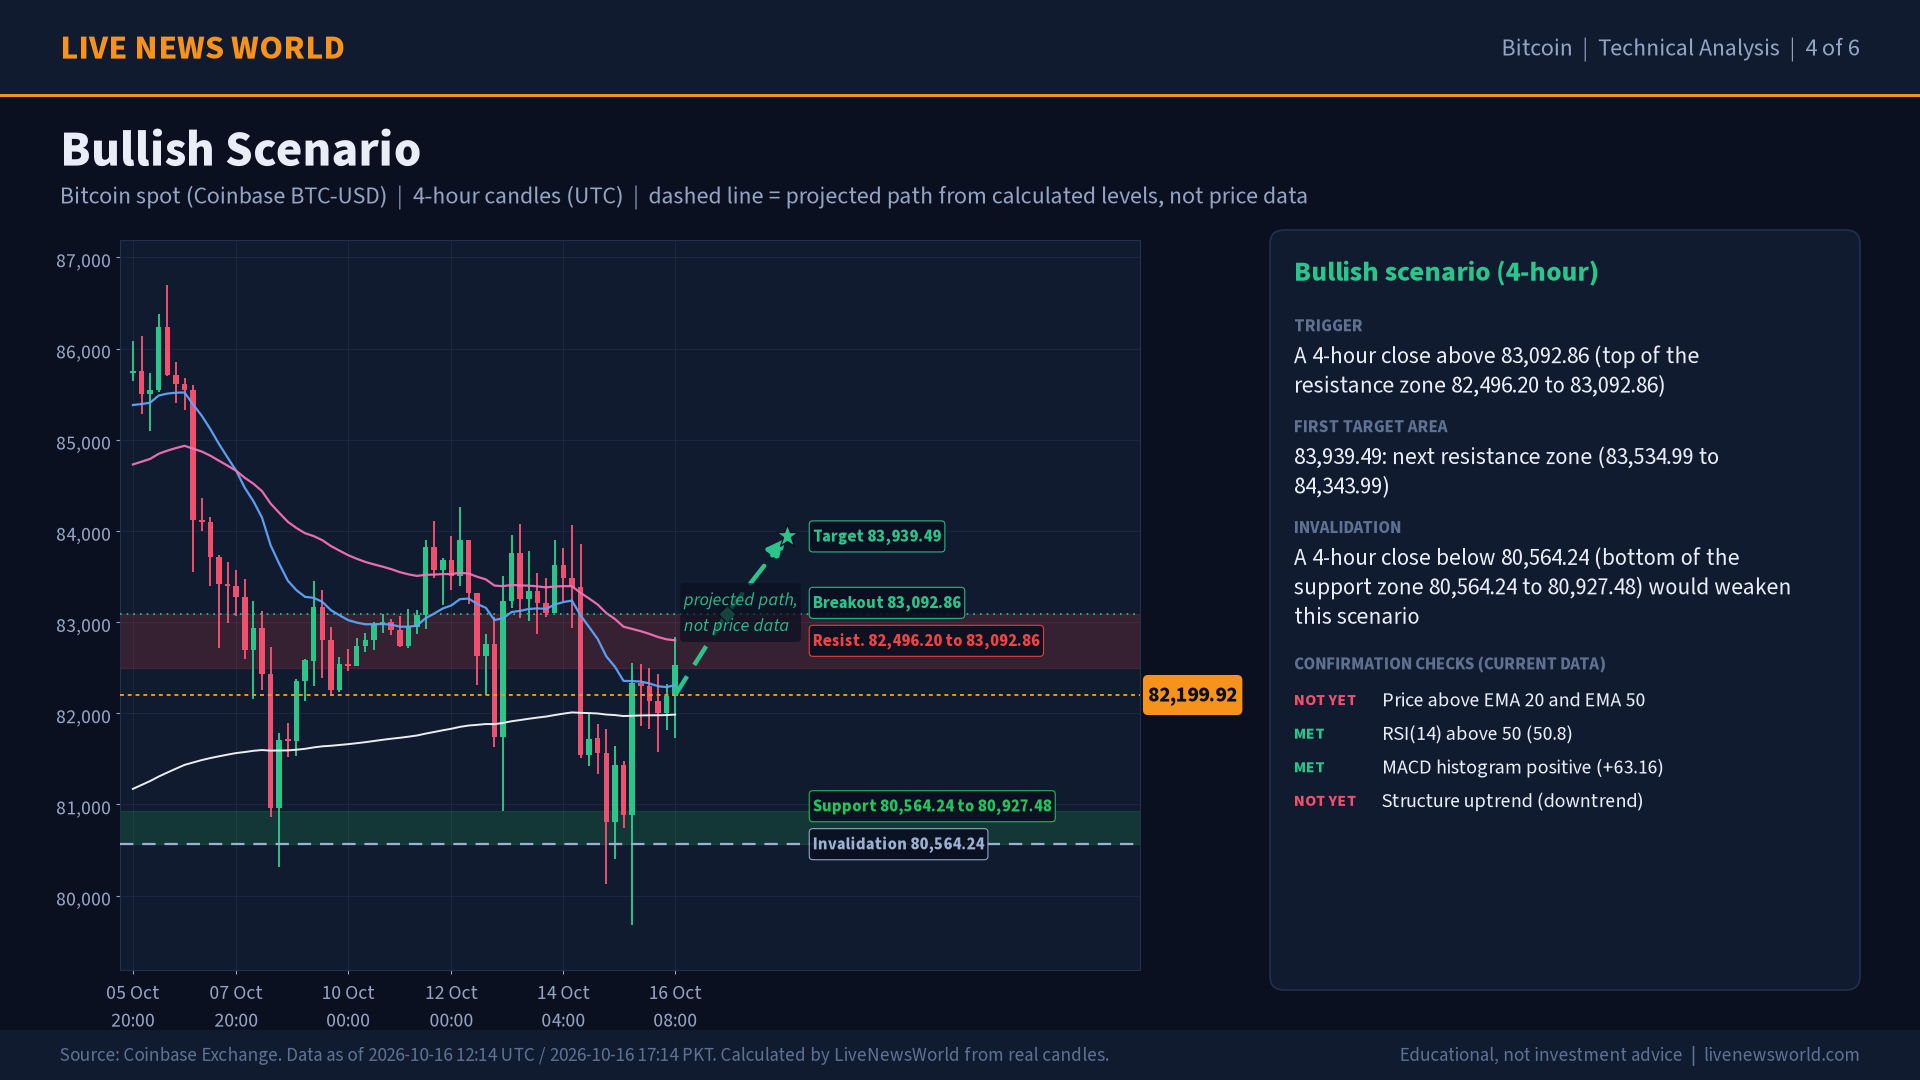
Bullish scenario
Trigger: A 4-hour close above 83,092.86 (top of the resistance zone 82,496.20 to 83,092.86). First reference: 83,939.49, the next resistance zone (83,534.99 to 84,343.99). Invalidation: a 4-hour close below 80,564.24 would weaken the idea.
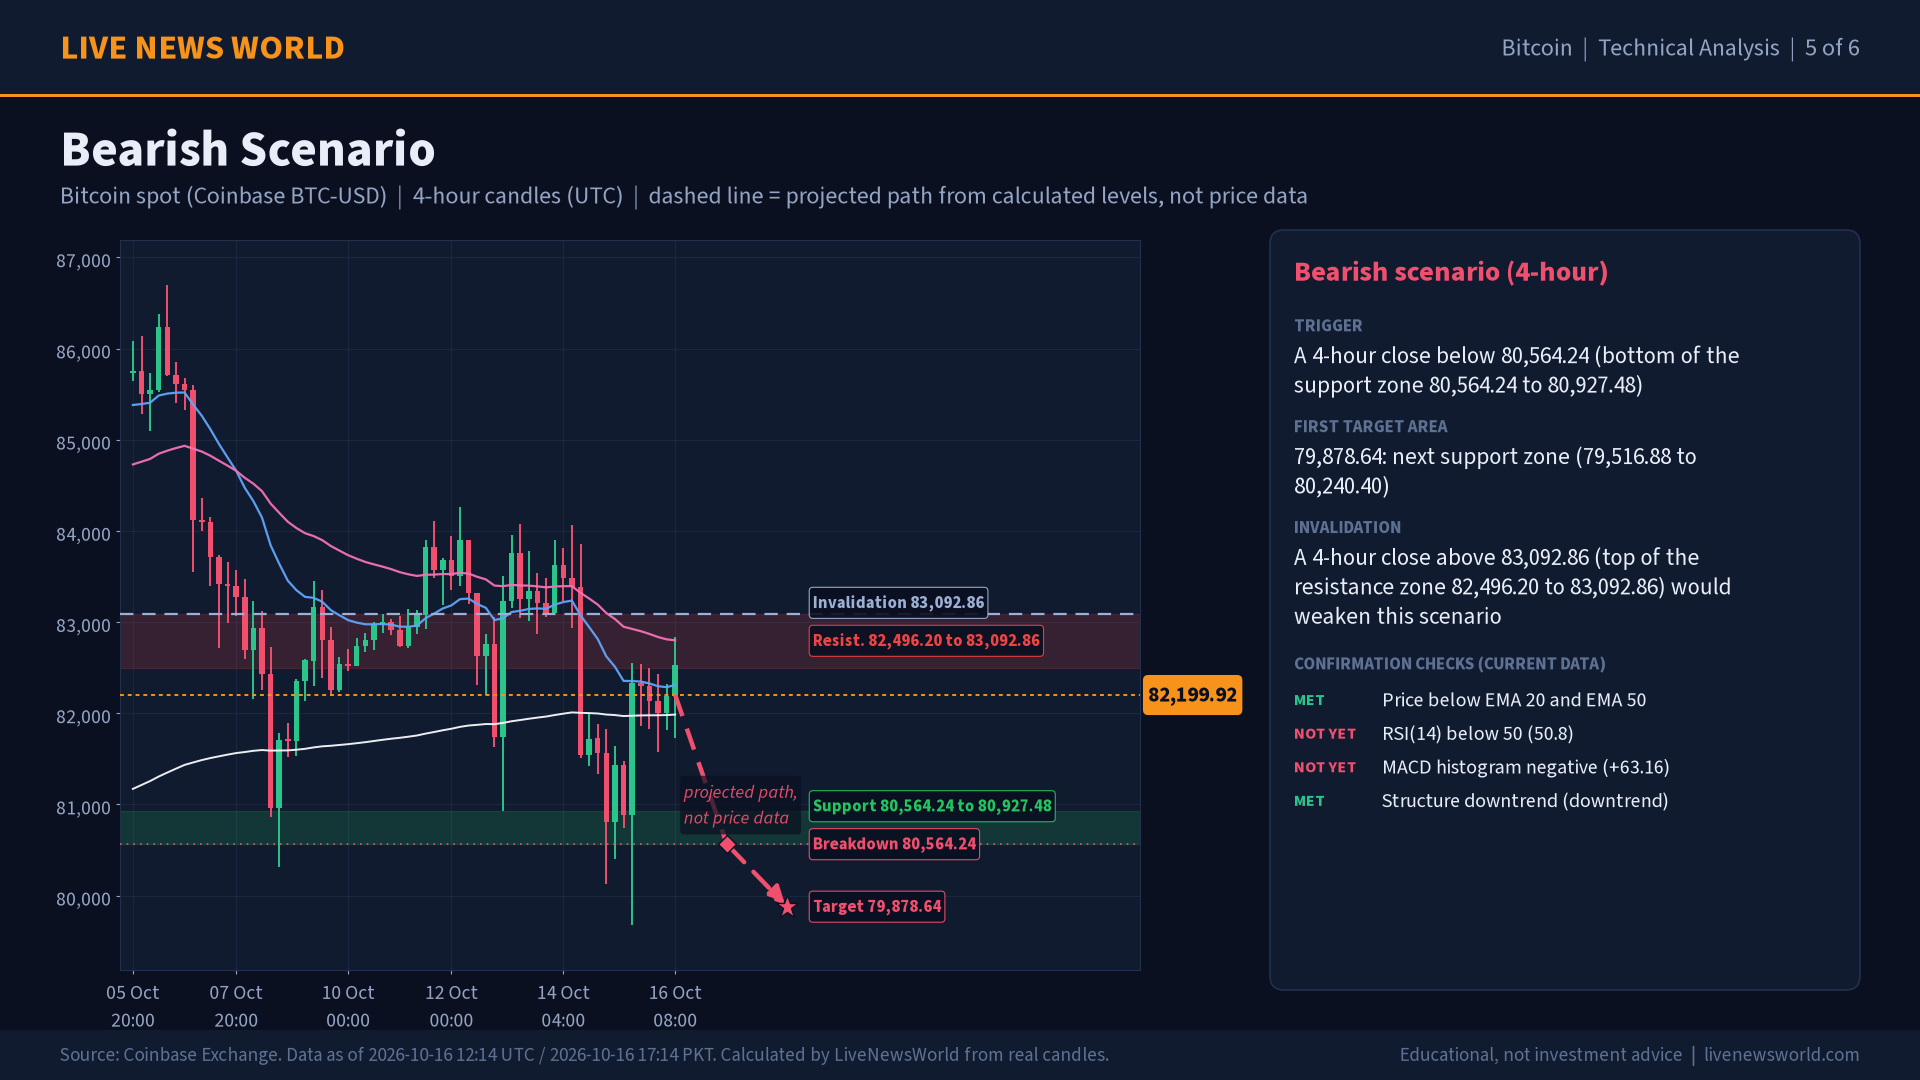
Bearish scenario
Trigger: A 4-hour close below 80,564.24 (bottom of the support zone 80,564.24 to 80,927.48). First reference: 79,878.64, the next support zone (79,516.88 to 80,240.40). Invalidation: a 4-hour close above 83,092.86 would weaken the idea.
Neutral scenario
Condition: 4-hour closes stay between 80,564.24 and 83,092.86. In that case Bitcoin stays in a range while price keeps rotating between these zone edges without a confirmed close beyond either one. Mixed signals across timeframes (15m bullish, 1h neutral, 4h neutral, 1d neutral) support patience until a trigger is hit.
What to Watch Next
Bitcoin trades around the clock, so weekend and overnight moves can reach these levels at any time. Macro conditions such as interest-rate expectations also matter; see our federal funds rate explainer and the 10-year Treasury yield.
Scheduled items in the next two weeks:
- The Federal Reserve FOMC meeting (27 and 28 October), 27 October.
Reference pages: Coinbase Exchange candles documentation and Federal Reserve FOMC calendar.
Sources and Data Notes
Data sources: Coinbase Exchange (BTC-USD spot); Bitstamp BTC/USD ticker; CNBC BTC=; Kraken XBT/USD ticker; Kraken daily candle (completed UTC day 2026-10-15). Candles are Coinbase BTC-USD spot, UTC-aligned. Other exchanges can print slightly different prices. Indicators, zones and scenarios are LiveNewsWorld calculations. Yahoo Finance data are delayed and unofficial.
This article is for informational and educational purposes only and does not constitute personalized financial or investment advice. Market conditions can change rapidly.