Key Points
- The Bureau of Labor Statistics publishes the CPI; the Bureau of Economic Analysis publishes the PCE price index. The Federal Reserve defines its 2% inflation goal using PCE.
- CPI tracks out-of-pocket spending by urban households. PCE also counts spending made on people’s behalf, such as employer-provided health insurance, Medicare and Medicaid.
- Housing makes up 35.6% of the CPI but about 16% of PCE spending, while health care accounts for about 17% of PCE spending and 8.4% of the CPI.
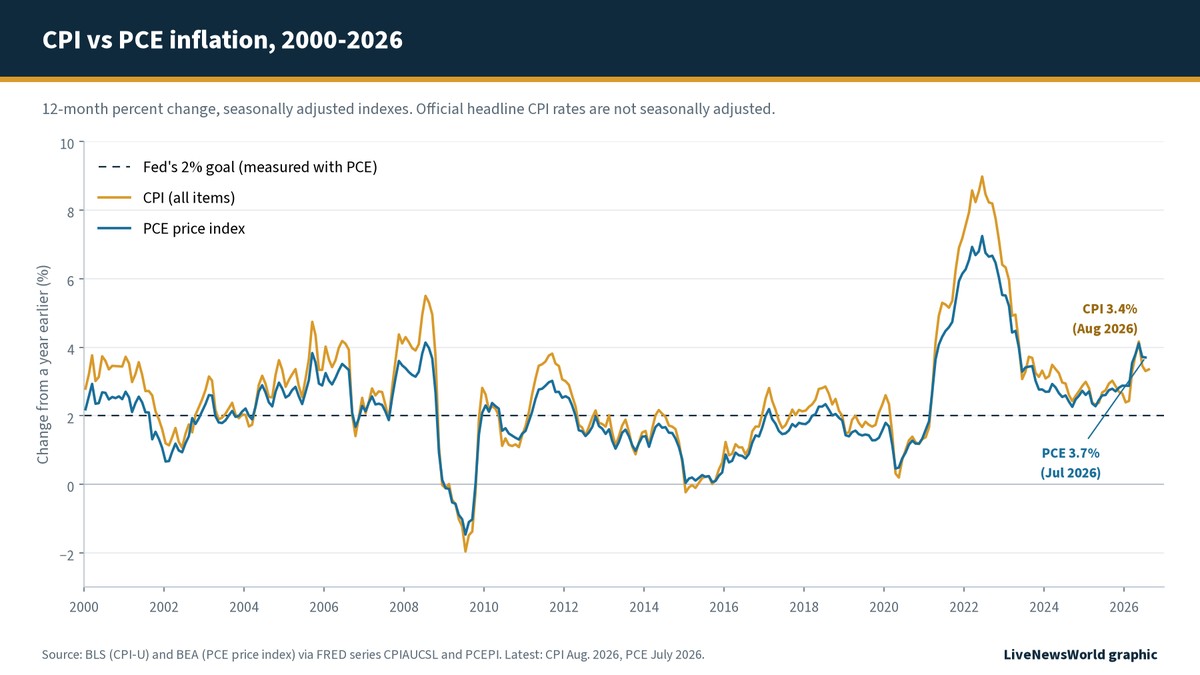
- Since 2000, CPI inflation has run 0.36 percentage point above PCE inflation on average, yet in July 2026 PCE inflation (3.7%) was higher than CPI inflation (3.4%).
- Versions of the CPI determine Social Security cost-of-living adjustments and TIPS inflation adjustments, while PCE anchors the Fed’s interest rate decisions.
CPI vs PCE is the difference between two official yardsticks for the same thing: how fast prices are rising for American consumers. The Consumer Price Index (CPI) is the better-known number, the one behind most inflation headlines and Social Security raises. The Personal Consumption Expenditures (PCE) price index is broader, is built differently, and is the measure the Federal Reserve targets. The two usually move together, but they rarely match, and the gap can shape everything from interest rate decisions to how you read the monthly news.
Here is what each index measures, why they differ, which one matters for what, and how to interpret the numbers when they disagree.
What is the Consumer Price Index (CPI)?
The CPI is produced by the U.S. Bureau of Labor Statistics (BLS) and released monthly, usually around the middle of the month. It measures the change in prices paid by consumers for a fixed basket of goods and services, from groceries and gasoline to rent, airline fares and doctors’ visits.
The headline version, the CPI for All Urban Consumers (CPI-U), reflects the spending of more than 90% of the U.S. population, according to BLS. Prices are collected each month in 75 urban areas from about 6,000 housing units and roughly 22,000 retail and service establishments. People in rural areas, farm households, the armed forces and institutions are not included.
The CPI has an unusually direct effect on household budgets. Social Security’s annual cost-of-living adjustment is based on a close relative, the CPI for Urban Wage Earners and Clerical Workers (CPI-W). The principal of Treasury Inflation-Protected Securities (TIPS) is adjusted using the CPI, and BLS notes that many union contracts and pension plans tie pay changes to it as well.
What is the PCE price index?
The PCE price index comes from the U.S. Bureau of Economic Analysis (BEA) and is published in its monthly Personal Income and Outlays report, typically near the end of the month. BEA describes it as a measure of the prices that people living in the United States, or those buying on their behalf, pay for goods and services.
That last phrase is the key. PCE captures not only what households pay out of pocket, but also spending made for them by third parties, such as employers paying for health insurance or the government paying through Medicare and Medicaid. PCE data go back to 1959. It has been the Fed’s preferred inflation measure since 2000, according to the Federal Reserve Bank of Cleveland, and when the Fed formally adopted a 2% inflation goal in 2012, it defined that goal in terms of PCE.
CPI vs PCE: the key differences at a glance
| Feature | CPI | PCE price index |
|---|---|---|
| Publisher | Bureau of Labor Statistics | Bureau of Economic Analysis |
| Release timing | Around mid-month | Near month-end, typically two to three weeks after CPI |
| Whose spending | Out-of-pocket spending by urban households | All U.S. residents, plus spending made on their behalf |
| Housing weight | 35.6% (shelter, Dec. 2025) | About 16% (housing, 2025 spending) |
| Health care weight | 8.4% (medical care, Dec. 2025) | About 17% (health care services, 2025 spending) |
| Weights updated | Annually | Monthly |
| Revisions | CPI-U considered final when released (seasonally adjusted figures are revised) | Revised in later months and in annual updates |
| Main official uses | Social Security COLAs (via CPI-W), TIPS, many wage and pension contracts | The Fed’s 2% inflation goal |
Sources: BLS CPI release and relative importance tables; BEA; Federal Reserve Bank of Cleveland; FRED. PCE shares are LiveNewsWorld calculations from BEA spending data.
Why CPI and PCE give different readings
Economists usually group the differences into three buckets: what each index covers, how much weight each item gets, and the formula used to add everything up.
1. Scope: who is paying
Because PCE counts third-party payments, it includes the full cost of medical care paid by employers and government programs, not just a patient’s co-pay. It also covers rural households, which the CPI leaves out. The CPI, by design, focuses on what urban consumers hand over themselves.
2. Weights: what counts most
Weights reflect the share of total spending each category represents. Many are similar across the two indexes, food being one example. The big exceptions are housing and health care, as the chart below shows.
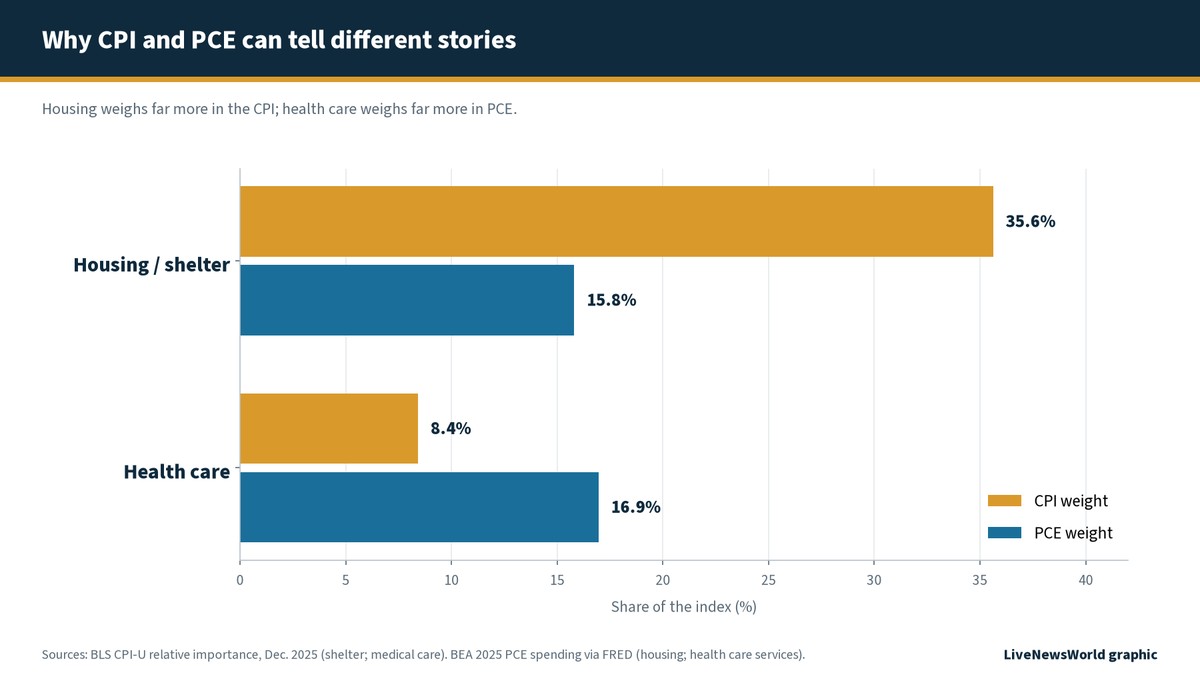
Shelter, which includes rent and the estimated rental value of owner-occupied homes, accounted for 35.6% of the CPI in December 2025, according to BLS. In PCE, housing made up about 15.8% of 2025 spending, based on BEA data. Health care runs the other way: medical care was 8.4% of the CPI, while health care services were about 16.9% of PCE spending. So a jump in rents moves the CPI far more, while rising hospital and physician costs move PCE more.
3. Formula: how quickly the basket adapts
The PCE formula updates its weights every month, while CPI weights are updated once a year. That lets PCE pick up substitution more quickly: when beef prices climb and shoppers switch to chicken, PCE reflects the new spending mix sooner. The Cleveland Fed notes that this ability to capture substitution toward cheaper options helps explain why PCE inflation tends to run lower than CPI inflation.
Why the Federal Reserve targets PCE
The Fed’s policy committee judges that inflation of 2% over the longer run, “as measured by the annual change in the price index for personal consumption expenditures,” is most consistent with its mandate for maximum employment and stable prices, according to the Federal Reserve Board.
PCE’s appeal lies in its breadth and flexibility. It covers more of what the economy actually spends on, and its monthly-updated weights track changing habits. It can also be revised as better source data arrive, which helps when looking at longer trends. Our explainer on what the Federal Reserve does and why it matters to you covers how that 2% goal feeds into interest rate decisions.
That does not mean the CPI is ignored. Because it arrives two to three weeks earlier for the same month, investors and policymakers treat it as the first major read on inflation. In September 2026, for example, BLS released August CPI on Sept. 11, while BEA scheduled August PCE for Sept. 30.
How big is the gap between CPI and PCE?
Over long periods the gap is modest but persistent, and it compounds. The chart tracks both measures since 2000.
| Measure (Jan. 2000 to July 2026) | Result |
|---|---|
| Average gap, CPI minus PCE inflation | 0.36 percentage point |
| Months in which CPI inflation was higher | 261 of 318 |
| Months in which PCE inflation was higher | 57 of 318 |
| Cumulative rise in the price level, CPI | 96.6% |
| Cumulative rise in the price level, PCE | 80.5% |
12-month changes in seasonally adjusted indexes. Source: FRED series CPIAUCSL (BLS) and PCEPI (BEA). LiveNewsWorld calculations.
The gap tends to widen when inflation surges. At the 2022 peak, 12-month CPI inflation reached about 9%, compared with about 7% for PCE, on seasonally adjusted data.
But “CPI runs hotter” is a tendency, not a law. In July 2026, the latest month available for both, the relationship flipped:
| 12-month change, July 2026 | Headline | Core (excluding food and energy) |
|---|---|---|
| CPI (BLS) | 3.4% | 2.5% |
| PCE price index (BEA) | 3.7% | 3.3% |
Sources: BLS CPI release for August 2026 (July figures cited in text); BEA Personal Income and Outlays, July 2026. CPI 12-month rates are not seasonally adjusted.
For August, BLS reported headline CPI inflation of 3.4% and core CPI of 2.4%. BEA’s August PCE figures, due Sept. 30, 2026, will arrive alongside its annual update, which can revise earlier months.
Differences in weights are the natural place to look when the order reverses. Because health care counts roughly twice as much in PCE and housing less than half as much, periods when rents cool while other categories heavily weighted in PCE stay firm can push PCE above CPI.
Core CPI vs core PCE
Both agencies also publish “core” versions that strip out food and energy, whose prices swing sharply with weather, harvests and oil markets. Core measures are not a better guide to the cost of living; you still pay for groceries and fuel. They are used to judge underlying inflation trends, which is why Fed officials and markets watch core PCE closely. The same weight differences apply, so core CPI and core PCE can diverge too, as they did by 0.8 percentage point in July 2026.
Which inflation measure matters for you?
- If you receive Social Security: your annual raise follows the CPI-W. The Social Security Administration set a 2.8% COLA for benefits payable from January 2026 and will announce the next one in October 2026.
- If you own TIPS: Treasury adjusts their principal using the CPI.
- If you borrow or save: PCE matters more indirectly, because it anchors the Fed’s decisions on interest rates, which filter through to mortgages, credit cards and savings yields.
- If you follow markets: CPI day often moves stocks and bonds first; PCE confirms or complicates the picture a few weeks later. Our guide to reading U.S. jobs reports covers the other half of the Fed’s dashboard.
Both gauges respond to the same underlying forces, from government spending to import tariffs that raise prices for consumers. They simply weigh the results differently.
Common misconceptions
- “One index is real and the other is spin.” Both are official statistics built on published methods. They answer slightly different questions: CPI asks what urban households pay out of pocket, while PCE asks what all consumer spending in the economy costs.
- “PCE is always lower.” It usually is, but not always. PCE inflation was higher in 57 of the 318 months since January 2000, including July 2026.
- “The Fed only looks at PCE.” PCE defines the target, but the CPI is the earlier signal and is followed closely by markets and policymakers alike.
- “A small gap does not matter.” Compounded over more than 26 years, a gap of about a third of a point a year separated a 96.6% rise in CPI from an 80.5% rise in PCE.
Video: the difference between CPI and PCE
This short Yahoo Finance explainer covers how the two inflation reports differ and why the Fed leans on PCE.
Frequently asked questions
Which is more accurate, CPI or PCE?
Neither is simply “more accurate.” PCE is broader and adapts faster to changing spending habits, which is why the Fed prefers it. CPI is closer to what urban households pay directly, which is why it is used for Social Security and TIPS.
Why does CPI usually run higher than PCE?
The Cleveland Fed points mainly to the formula: PCE updates its spending weights monthly and captures substitution toward cheaper goods more quickly. Differences in scope and weights, such as the much larger role of housing in the CPI, also shape the gap from month to month.
When are CPI and PCE released?
BLS publishes the CPI around the middle of each month for the previous month. BEA publishes PCE in its Personal Income and Outlays report near the end of the month. September 2026 CPI is scheduled for Oct. 14, 2026, according to BLS.
What is the Fed’s inflation target based on?
The Fed aims for 2% inflation over the longer run, measured by the annual change in the PCE price index.
The bottom line
The CPI vs PCE question comes down to purpose. The CPI measures what city households pay out of pocket and drives benefits and contracts that millions of Americans rely on. The PCE price index measures the cost of all consumer spending in the economy, adapts faster to changing habits, and sets the benchmark for the Federal Reserve. When the two diverge, the reason usually lies in housing, health care and the formula, and knowing that helps you read each month’s inflation news with more confidence.