Key Points
- The yield curve inverts when short-term U.S. Treasury yields rise above long-term yields. Markets usually track it through the gap between 10-year and 2-year yields, or 10-year and 3-month yields.
- In Treasury data going back to 1976, at least one of those gaps turned negative before each of the six U.S. recessions that followed, typically 8 to 22 months ahead of the business-cycle peak.
- The longest unbroken inversion in that data, from July 2022 to August 2024 on the 10-year/2-year measure, has not been followed by a recession, based on the latest NBER dating.
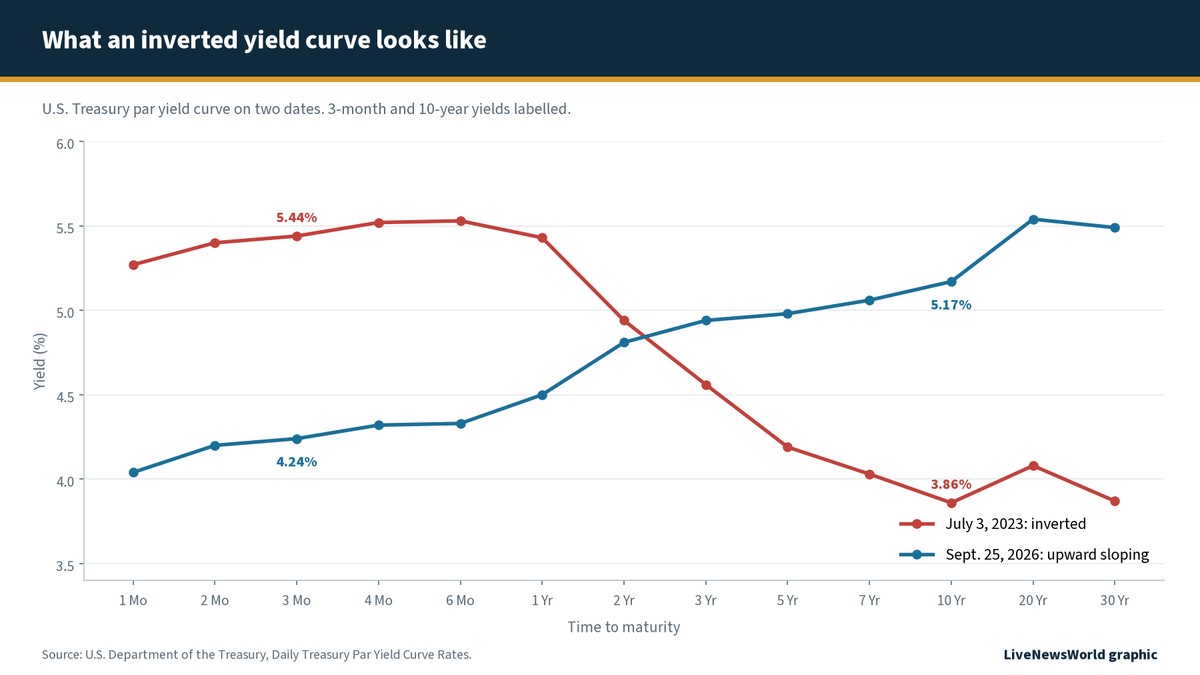
- On Sept. 25, 2026, the curve sloped upward: the 10-year yield stood at 5.17%, above the 2-year at 4.81% and the 3-month at 4.24%.
An inverted yield curve is what happens when short-term U.S. government bonds pay higher interest rates than long-term ones. That is the reverse of normal, and it matters because an inverted curve has come before every U.S. recession of the past half century. It works as a warning light, not a countdown clock. Timing varies widely, and the most recent inversion, the longest on record, has so far not produced a downturn.
This guide explains what the yield curve is, why it flips, how good its track record really is, and how to read it without overreacting to the headlines it tends to generate.
What is the yield curve?
The yield curve is a simple chart. It plots the interest rates (yields) on U.S. Treasury securities against how long each one takes to mature, from one-month bills to 30-year bonds. The U.S. Treasury publishes these rates every business day on its daily par yield curve page.
In normal times the line slopes upward. Investors who lock their money away for 10 or 30 years usually demand a higher return than those lending for three months. Part of that reward compensates for inflation risk, and part compensates for the uncertainty of tying up money for a long time.
Because Treasuries are backed by the U.S. government, differences in their yields mostly reflect time and expectations rather than the risk of default. That makes the curve a clean read on what bond investors expect for interest rates, inflation and growth. For background on why the government borrows at all, see our explainer on how the U.S. national debt grew.
What does an inverted yield curve mean?
An inversion means the line tilts the other way: short-term yields sit above long-term yields. Investors are accepting less to lend for a decade than for a few months. That only makes sense if they expect short-term rates to fall in the future, which usually happens when the economy weakens and the Federal Reserve cuts rates.
Analysts rarely look at the whole curve. Instead they track a “spread,” the difference between two yields:
- 10-year minus 2-year: the spread most often quoted in market coverage.
- 10-year minus 3-month: a measure that closely reflects current Fed policy, because 3-month bill yields track the Fed’s policy rate.
When either spread drops below zero, the curve is described as inverted. The chart below shows what that looks like in practice, comparing a deeply inverted day in 2023 with the curve in late September 2026.
Normal, flat and inverted curves compared
| Shape | What it looks like | What investors are signalling |
|---|---|---|
| Normal (upward sloping) | Long-term yields above short-term yields | Steady growth expected; extra pay for lending longer |
| Flat | Short and long yields roughly equal | Uncertainty; often a transition phase |
| Inverted | Short-term yields above long-term yields | Rate cuts and slower growth expected ahead |
| Steepening after inversion | Short-term yields fall back below long-term yields | Often reflects rate cuts already under way; not an automatic all-clear |
Why does the yield curve invert?
Short-term and long-term yields are driven by different forces, and an inversion happens when those forces pull in opposite directions.
The Fed pushes short-term rates up
Short-term Treasury yields follow the Federal Reserve’s policy rate closely. When the Fed raises rates to cool inflation, bill yields rise with it. Between March 2022 and July 2023, for example, the Fed lifted the top of its federal funds target range from 0.25% to 5.50%, according to Federal Reserve data compiled by the St. Louis Fed. Short-term yields climbed quickly as a result. Our guide to what the Federal Reserve does and why it matters explains how that policy rate works.
Investors expect rates to fall later
Long-term yields reflect what investors think short-term rates will average over many years. If they believe today’s high rates will slow the economy and force the Fed to cut later, they are happy to lock in a 10-year yield even if it is lower than today’s bill rate. That expectation pulls long-term yields down while short-term yields stay high.
Demand for safety
When investors grow nervous, they often buy long-dated Treasuries as a safe store of value. Heavy buying raises bond prices and lowers their yields, which can deepen an inversion.
The inverted yield curve’s recession track record
The reason inversions make headlines is their history. The chart below plots both widely watched spreads since 1976, with U.S. recessions shaded. Each dip below zero before a shaded bar is an inversion that came before a downturn.
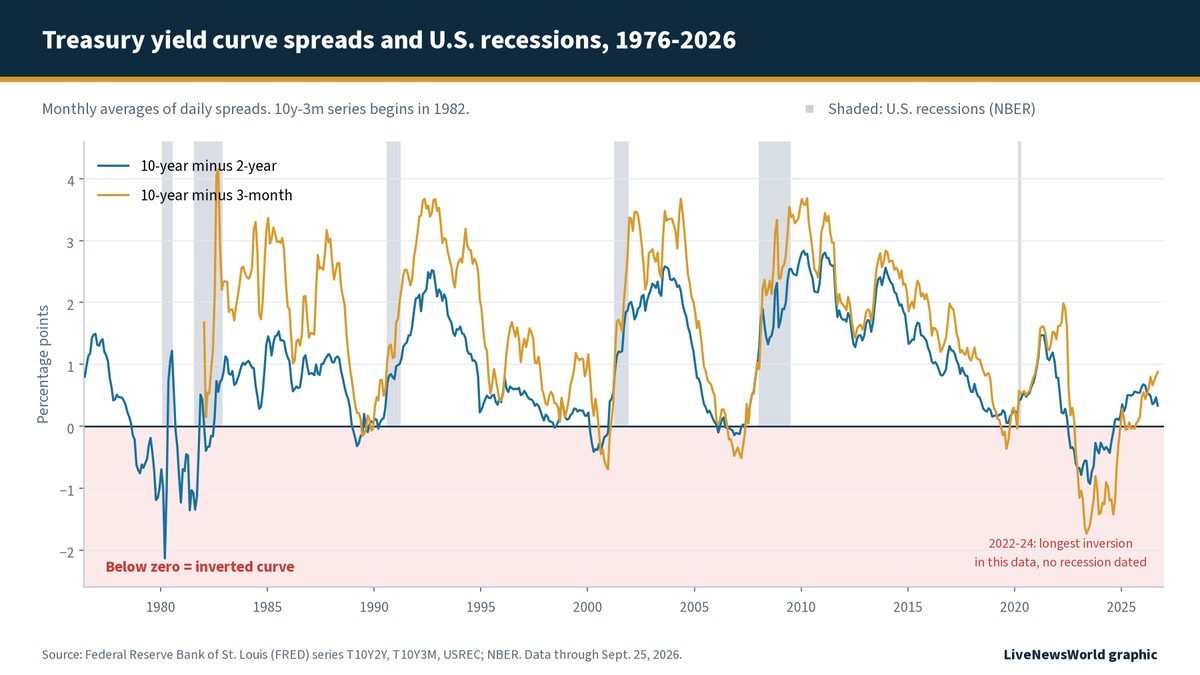
The table sets out each recession since 1976 alongside the month each spread first averaged below zero. Recession dates come from the National Bureau of Economic Research, the official arbiter of U.S. business cycles. Lead times run from the first inverted month to the business-cycle peak, the last month before the recession begins.
| Recession (NBER peak to trough) | 10y-2y first inverted | 10y-3m first inverted | Lead to peak |
|---|---|---|---|
| Jan. 1980 to July 1980 | Sept. 1978 | No data (series starts 1982) | 16 months |
| July 1981 to Nov. 1982 | Sept. 1980 | No data | 10 months |
| July 1990 to March 1991 | Jan. 1989 | June 1989 | 18 / 13 months |
| March 2001 to Nov. 2001 | Feb. 2000 | July 2000 | 13 / 8 months |
| Dec. 2007 to June 2009 | Feb. 2006 | Aug. 2006 | 22 / 16 months |
| Feb. 2020 to April 2020 | Only a three-day dip (Aug. 2019) | May 2019 | 9 months (10y-3m) |
| No recession dated so far | July 2022 to Aug. 2024 | Nov. 2022 to Nov. 2024 | Not applicable |
Based on monthly averages of daily spreads. Sources: FRED series T10Y2Y and T10Y3M (Federal Reserve Bank of St. Louis); NBER business cycle dates. LiveNewsWorld calculations.
What the record shows
The hit rate is high. Every recession in this period was preceded by an inversion in at least one of the two measures. Few economic indicators can claim that.
The timing is loose. Lead times in the table range from 8 to 22 months. An inversion does not tell you whether trouble is a season away or nearly two years off.
It is not perfect. The 10-year/2-year spread briefly averaged below zero in June 1998, almost three years before the 2001 recession began. More strikingly, the 2022 to 2024 inversion was the longest unbroken run below zero in either series, lasting just over two years in each, yet the NBER has not dated a recession since the brief pandemic downturn of 2020.
The 2020 case needs care. The curve did invert in 2019, but the recession that followed was triggered by the COVID-19 pandemic. An inversion can flag vulnerability; it cannot foresee the shock that turns vulnerability into a downturn.
Why an inversion can matter for the real economy
The yield curve is mostly a signal of what investors expect. There is also a practical channel through which it can bite. Banks typically fund themselves with short-term deposits and borrowing, and lend for longer periods. When short-term rates rise above long-term rates, that business becomes less profitable, which can make lenders more cautious about extending credit. Tighter credit can in turn slow spending and investment.
Stock investors watch the curve for the same reason. It is one of several warning signs discussed in our look at what tends to come before stock market crashes, alongside stretched valuations and heavy borrowing.
Common misconceptions about the inverted yield curve
- “An inversion causes recessions.” It reflects expectations about rates and growth. The underlying causes of a downturn, such as tight monetary policy, a financial shock or collapsing demand, are separate.
- “A recession starts right away.” In the cycles above, the gap between the first inverted month and the business-cycle peak was never shorter than eight months.
- “When the curve un-inverts, the danger has passed.” In the 1990, 2001 and 2007 cycles, the 10-year/3-month spread had already turned positive again before the economy peaked. A re-steepening curve often reflects expected rate cuts, which tend to come when growth is weakening.
- “One day below zero counts.” Brief daily dips happen. Analysts generally look for inversions that persist, which is why the table above uses monthly averages.
How to read the yield curve today
As of the close on Thursday, Sept. 25, 2026, the Treasury curve was not inverted. Long-term yields sat above short-term yields across the main benchmarks:
| Treasury maturity | Yield on Sept. 25, 2026 |
|---|---|
| 3-month | 4.24% |
| 2-year | 4.81% |
| 10-year | 5.17% |
| 30-year | 5.49% |
| 10-year minus 2-year | +0.36 percentage point |
| 10-year minus 3-month | +0.93 percentage point |
Source: U.S. Department of the Treasury, Daily Treasury Par Yield Curve Rates.
A few practical habits help when the curve is in the news:
- Check which spread is being quoted. The 10-year/2-year and 10-year/3-month spreads can send different messages, as they did in 2019.
- Look for persistence. Weeks or months below zero carry more weight than a single session.
- Read it alongside other data. Hiring, consumer spending and inflation reports show whether the economy is actually slowing. Our guide on recession fears and economic slowdowns explains why no single indicator settles the question.
- Remember the lag. Even a reliable signal has historically given many months of notice, so it is a reason for attention rather than panic.
Video: why investors watch the inverted yield curve
This 2019 explainer from The Wall Street Journal walks through why investors pay so much attention to the shape of the curve.
Frequently asked questions
Does an inverted yield curve always mean a recession is coming?
No. It has preceded every U.S. recession since the late 1970s, but it has also produced false alarms. The long 2022 to 2024 inversion is the clearest example: no recession has been dated since.
How long after an inversion does a recession usually start?
In the six recessions since 1976, the first inverted month came between 8 and 22 months before the business-cycle peak, depending on the cycle and the spread used.
Which spread matters more, 10-year/2-year or 10-year/3-month?
Both are widely followed. The 10-year/2-year spread is the one most quoted in market news, while the 10-year/3-month spread tracks the Fed’s current policy rate more closely. In 2019, the 10-year/3-month spread inverted for months while the 10-year/2-year spread dipped below zero for only three days.
What does an inverted yield curve mean for savers and borrowers?
During an inversion, short-term savings products such as Treasury bills and some deposit accounts can pay more than longer-term bonds. Borrowing costs tied to short-term rates, such as many credit cards, tend to stay high. Longer-term rates, which influence mortgages, can be relatively lower.
The bottom line
The inverted yield curve earns its reputation. It has flashed before every recession in modern U.S. data, and it captures in one line what the bond market expects from the Fed and the economy. But it is a probability signal with a wide time window, and the 2022 to 2024 episode showed it can be wrong. Treat an inversion as a reason to watch jobs, spending and inflation data more closely, not as a forecast with a date attached.