Six-Slide Visual Analysis
Key Points
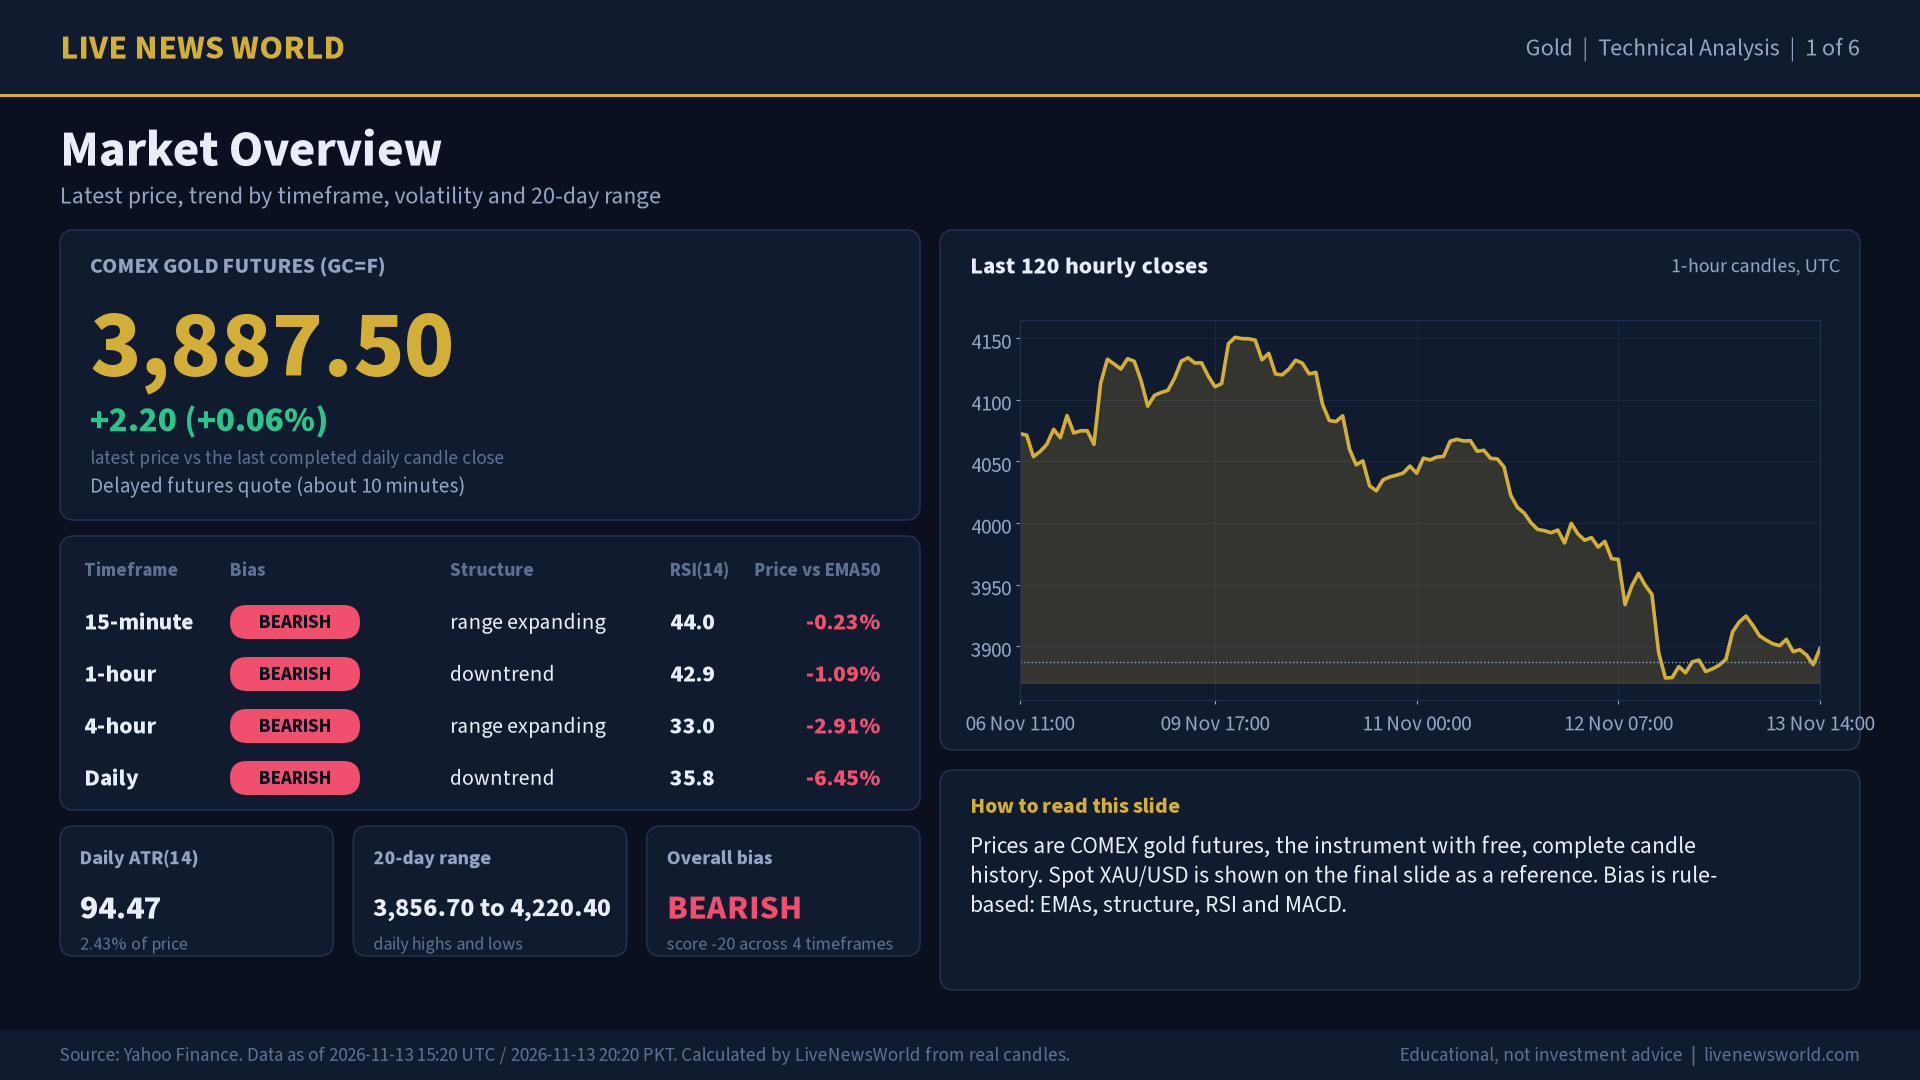
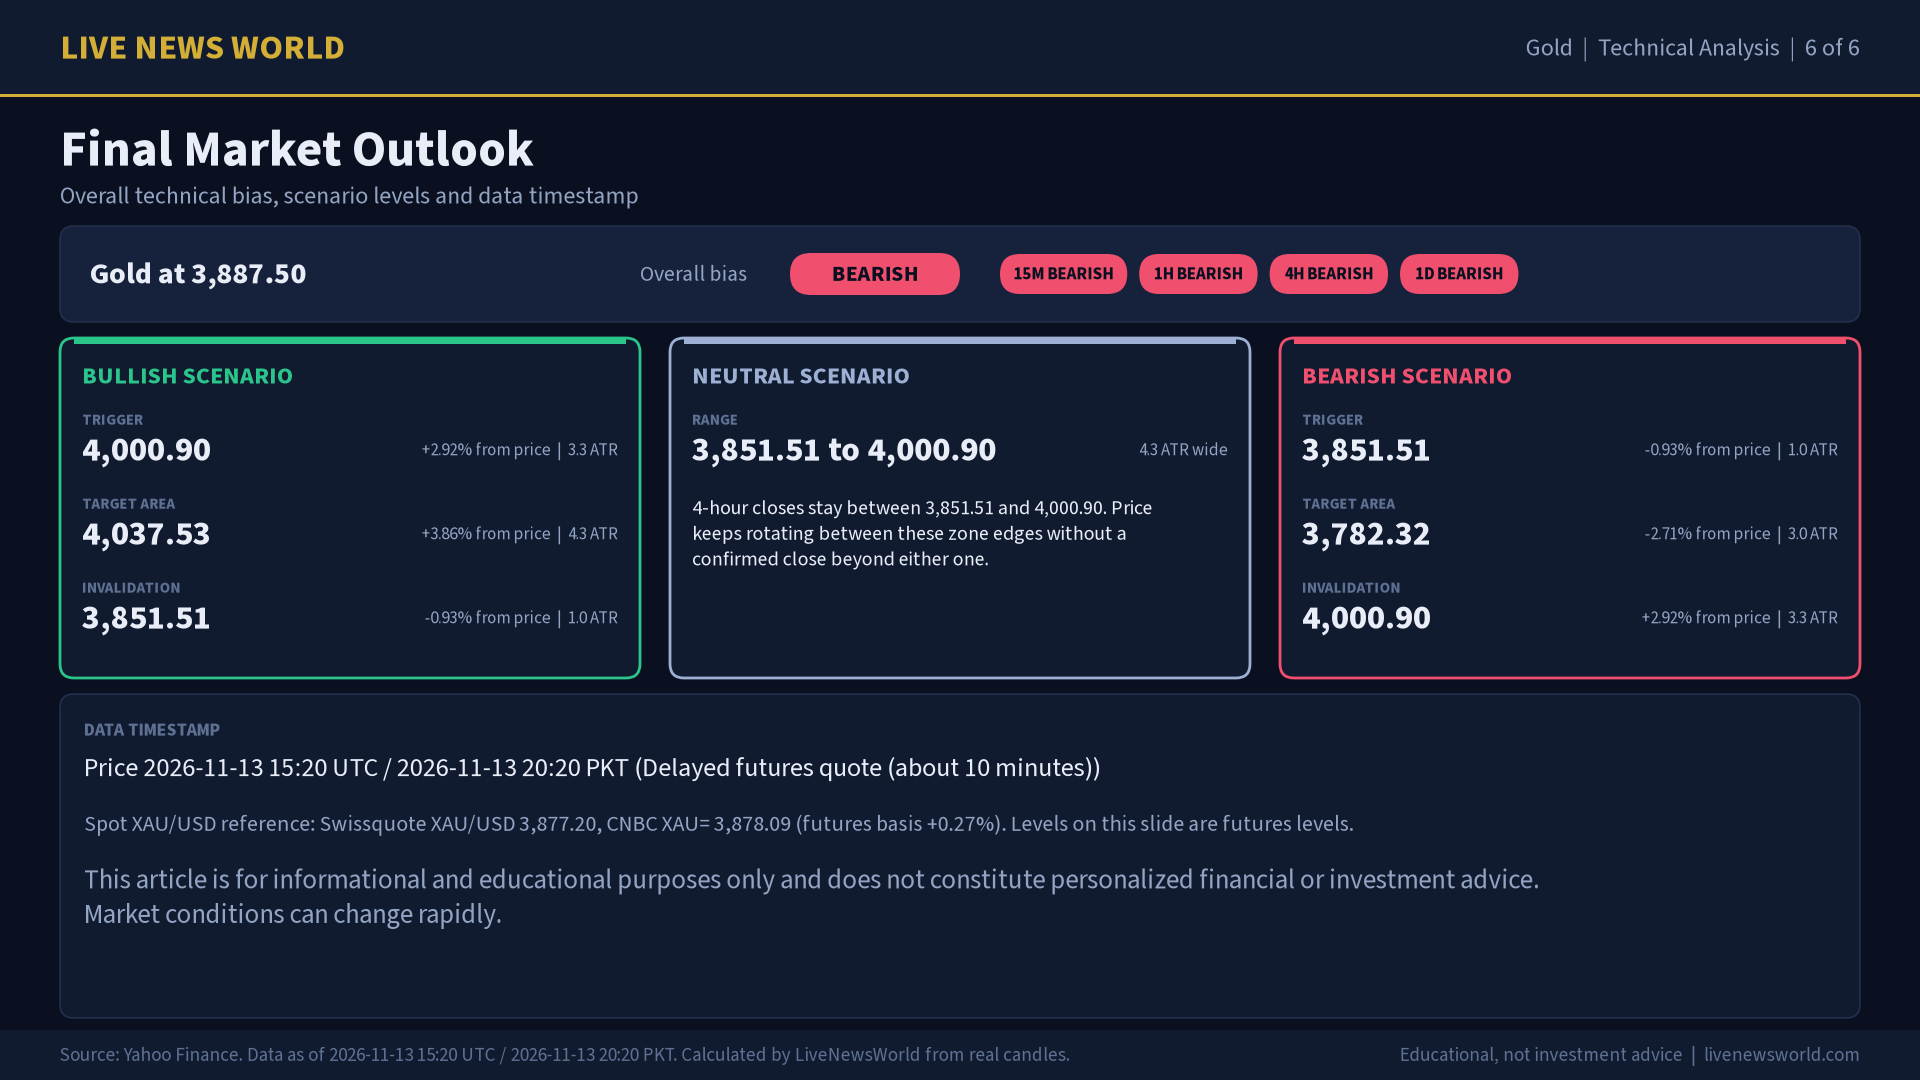
- Gold traded at 3,887.50 at 13 Nov 2026, 15:20 UTC (20:20 PKT), +0.06% versus the last completed daily close, according to Yahoo Finance (COMEX) data cross-checked with CNBC. Overall bias across four timeframes: bearish (score -20).
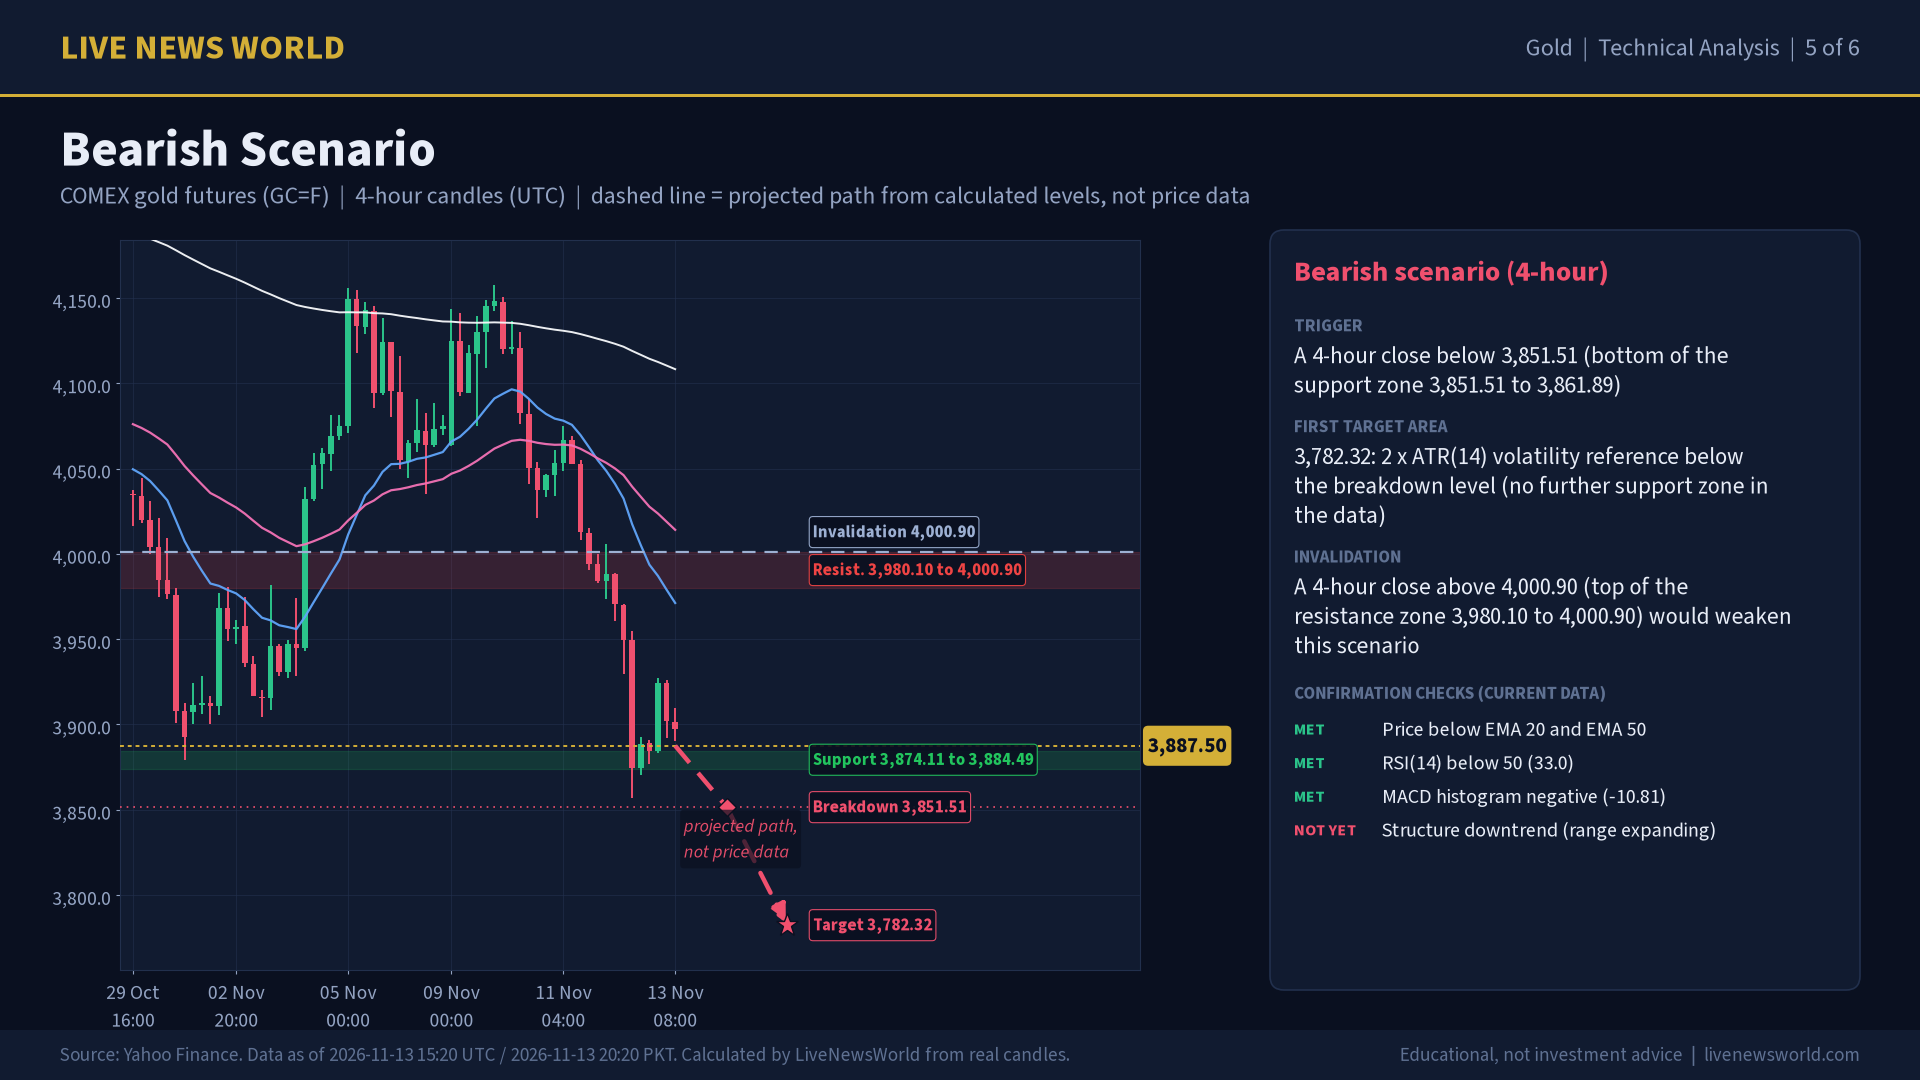
- Nearest 4-hour resistance zone 3,980.10 to 4,000.90; nearest 4-hour support zone 3,874.11 to 3,884.49.
- A 4-hour close above 4,000.90 would open the bullish scenario; a close below 3,851.51 would open the bearish one.
- Candles are COMEX gold futures, not spot XAU/USD; spot traded near 3,877.20 at the time of the check, according to Swissquote (XAU/USD spot mid).
- Macro backdrop this week: October CPI rose 0.4 percent and October PPI for final demand rose 0.3 percent according to the BLS, and the 10-year Treasury yield reached 5.10 percent on Nov. 12 according to Treasury data, as Fed officials signaled possible rate hikes.
Gold is trading near 3,887.50 as of 13 Nov 2026, 15:20 UTC (20:20 PKT). The market is open. This gold weekly outlook reads real COMEX gold futures (GC=F) candles on four timeframes (15-minute, 1-hour, 4-hour and daily), calculates support and resistance from swing points, and sets out three scenarios with exact trigger and invalidation levels. For live moves, follow Markets Live.
Market Overview
Data checked: 10:30 a.m. ET (15:30 UTC, 20:30 PKT), Fri., Nov. 13, 2026. Prices: Yahoo Finance (COMEX GC=F, quote 10:20 a.m. ET) and CNBC (@GC.1), cross-checked; the previous settlement of 3,885.30 is the last completed daily close in our data.
Gold traded at 3,887.50, up 0.06% from the last completed daily close, according to Yahoo Finance (COMEX) data. The latest quote comes from Yahoo Finance (COMEX); status: Delayed futures quote (about 10 minutes). Over the last 20 daily candles the range runs from 3,856.70 to 4,220.40, and the daily ATR(14) is 94.47 (2.43% of price), so a typical daily candle spans roughly that distance. Independent checks agree with the quote: CNBC @GC.1 (COMEX gold futures, same instrument) 3,888.70.
Futures versus spot: the candles and levels in this article are COMEX gold futures (GC=F, front month). Spot XAU/USD is a different quote: Swissquote quoted XAU/USD at 3,877.20 and CNBC quoted spot gold (XAU=) at 3,878.09. According to LiveNewsWorld calculations from those quotes, the futures price was +0.27% versus spot, a gap that can arise from carry and timing differences between the two quotes. Spot levels will sit slightly away from the futures levels below.
This Week’s Key Developments and Market-Moving Events
Hotter inflation data. The U.S. Bureau of Labor Statistics reported on Tuesday, Nov. 10 that the Consumer Price Index rose 0.4 percent in October on a seasonally adjusted basis, after 0.6 percent in September, while core CPI (excluding food and energy) rose 0.3 percent. The BLS said it could not publish most 12-month changes because October 2025 data were not collected during the lapse in appropriations. CNBC reported that both readings came in above economists’ forecasts.
Fed signals. The Federal Reserve held its target range at 3-3/4 to 4 percent on Oct. 28 in a 10 to 2 vote, with Lisa D. Cook and Beth M. Hammack preferring a quarter-point hike, according to the FOMC statement. In a Nov. 10 speech, Governor Christopher J. Waller said he was leaning toward a 25 basis point increase at the December meeting (Dec. 8-9 on the Fed’s calendar) and that a 50 basis point hike “should be considered” if core CPI came in around 0.3 percent or higher.
Higher yields, firmer dollar. Treasury’s daily par yield curve shows the 10-year yield at 5.10 percent on Nov. 12, up from 4.88 percent on Nov. 9, and the 2-year at 4.86 percent, up from 4.56 percent. An analyst quoted in a Reuters report published by CNBC cited a dollar index rally to a near 19-month high as a weight on gold, and the report said spot gold touched its lowest level since October 2025 on Thursday.
Geopolitics and oil. The same report said President Donald Trump stated on social media on Thursday that the U.S. did not need a deal with Iran, and that Brent crude rose more than 2 percent.
Producer prices. The BLS reported at 8:30 a.m. ET today, Nov. 13, that the Producer Price Index for final demand rose 0.3 percent in October, seasonally adjusted, after 1.4 percent in September. On an unadjusted basis the index rose 6.5 percent over 12 months, which the BLS said was the largest 12-month rise since November 2022. Final demand less foods, energy and trade services rose 0.5 percent, the same as in September. Kitco News reported that the headline figure was below economists’ expectations for a 0.4 percent gain and that spot gold was modestly higher in early U.S. trading as bargain hunting emerged after Thursday’s losses.
Next catalysts. Kitco listed Tuesday’s October retail sales figures and the minutes of the Fed’s October meeting, scheduled for Wednesday, Nov. 18, among the next data points for markets. The Fed’s next policy decision is due after its Dec. 8-9 meeting.
Technical Observations: Multi-Timeframe Picture
| Timeframe | Bias | Structure | RSI(14) | Price vs EMA 50 |
|---|---|---|---|---|
| 15-minute | Bearish | range expanding | 44.0 | -0.23% |
| 1-hour | Bearish | downtrend | 42.9 | -1.09% |
| 4-hour | Bearish | range expanding | 33.0 | -2.91% |
| Daily | Bearish | downtrend | 35.8 | -6.45% |
Source: LiveNewsWorld calculations from Yahoo Finance COMEX gold futures (GC=F) candles; data checked 10:30 a.m. ET, Nov. 13, 2026.
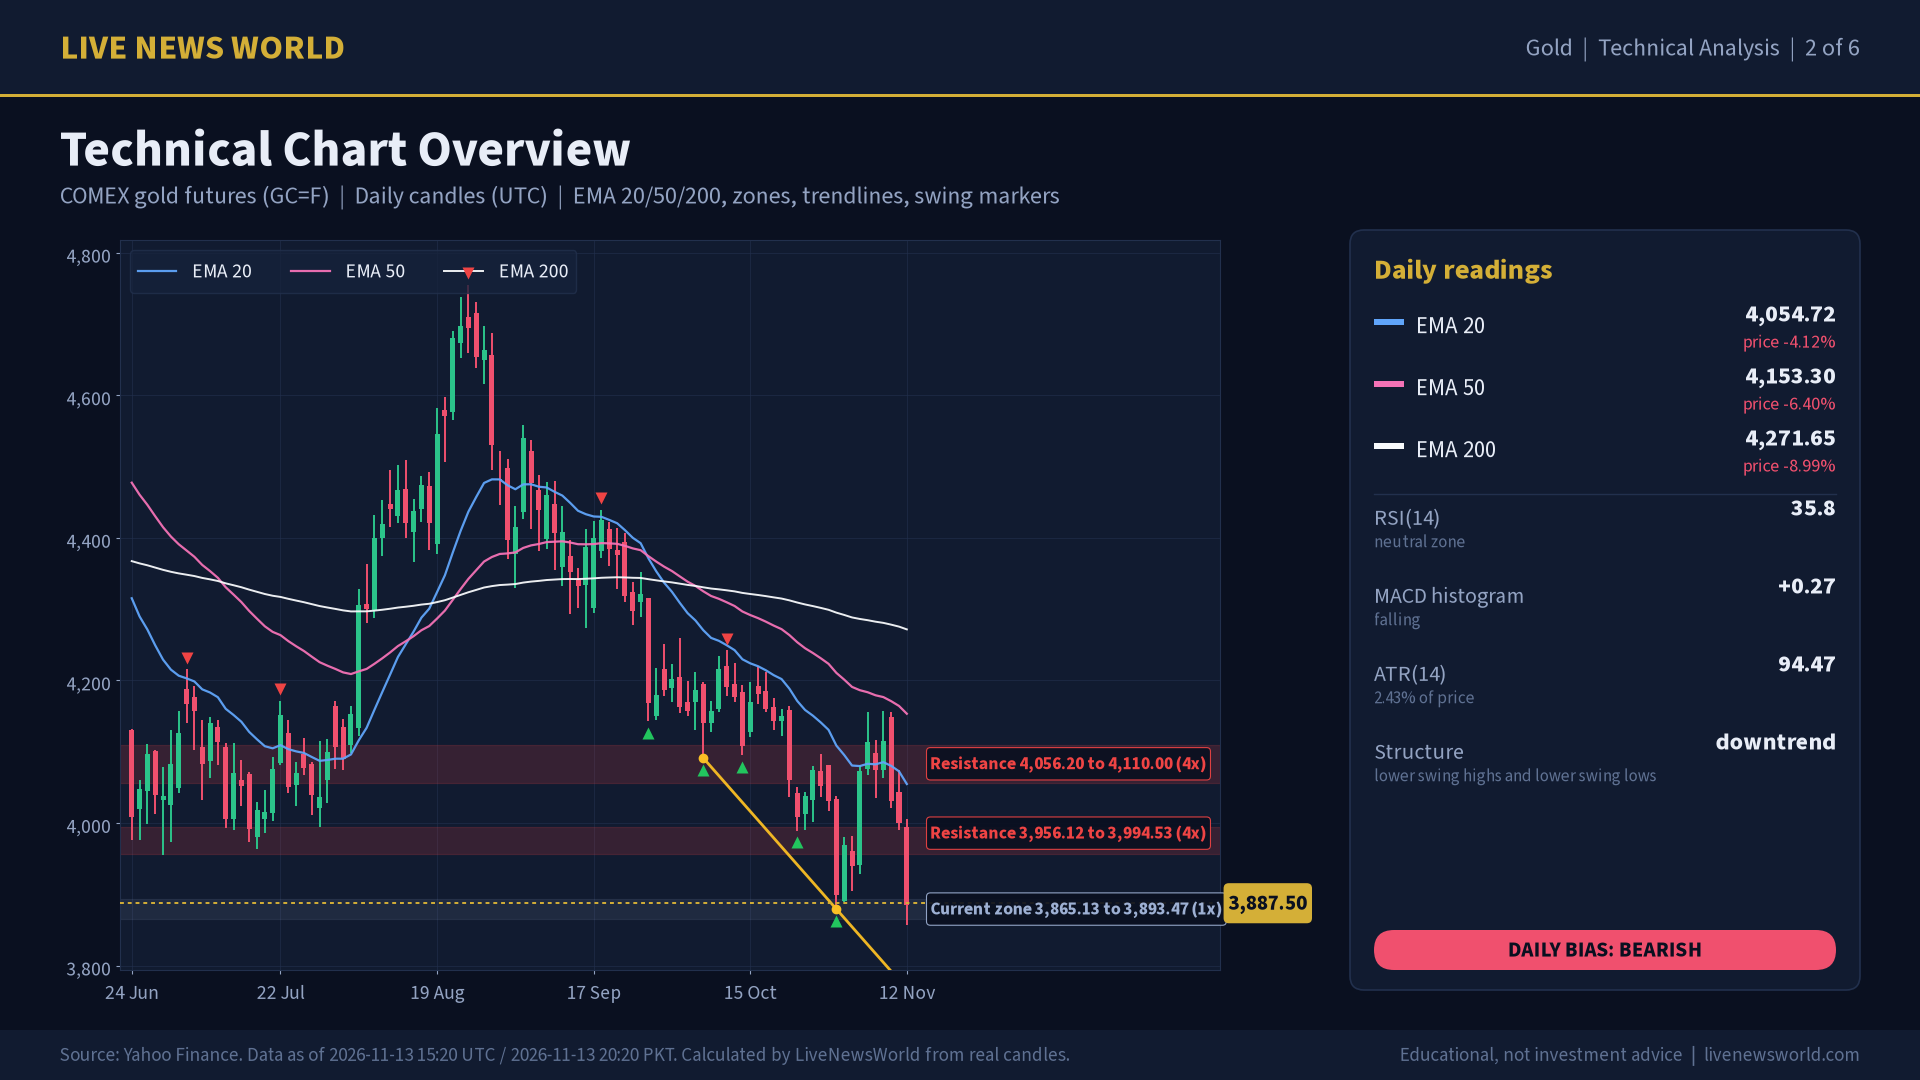
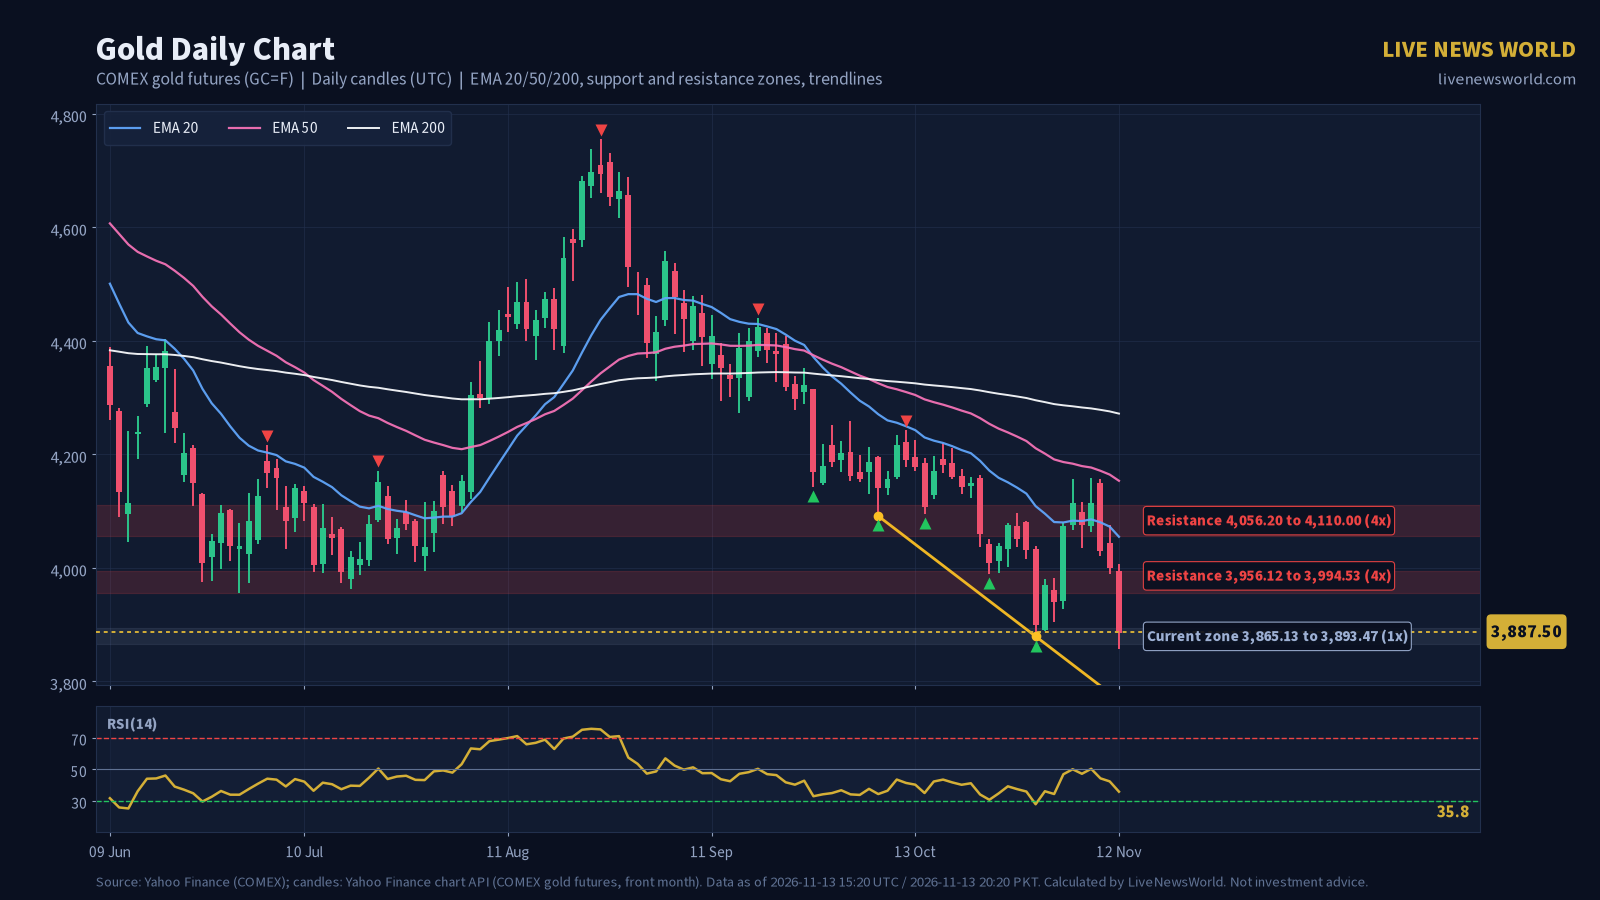
Daily timeframe. In data from Yahoo Finance (COMEX futures), the last completed daily candle (opened 2026-11-12 05:00 UTC) closed at 3,885.30. That is 4.18% below the 20-period EMA (4,054.72), 6.45% below the 50-period EMA (4,153.30) and 9.04% below the 200-period EMA (4,271.65). Swing structure shows lower swing highs and lower swing lows, which our rules classify as downtrend. RSI(14) is 35.8, below the neutral 50 line. The MACD histogram is +0.27, falling from +10.03 on the previous bar, with the MACD line above its signal line. The ATR(14) is 94.47, or 2.43% of price. Net, the daily timeframe leans bearish (score -5).
4-hour timeframe. In data from Yahoo Finance (COMEX futures), the last completed 4-hour candle (opened 2026-11-13 08:00 UTC) closed at 3,897.20. That is 1.86% below the 20-period EMA (3,971.18), 2.91% below the 50-period EMA (4,014.07) and 5.14% below the 200-period EMA (4,108.26). Swing structure shows higher swing high but lower swing low (widening range), which our rules classify as range expanding. RSI(14) is 33.0, below the neutral 50 line. The MACD histogram is -10.81, rising from -12.88 on the previous bar, with the MACD line below its signal line. The ATR(14) is 34.59, or 0.89% of price. Net, the 4-hour timeframe leans bearish (score -6).
1-hour timeframe. In data from Yahoo Finance (COMEX futures), the last completed 1-hour candle (opened 2026-11-13 14:00 UTC) closed at 3,898.20. That is 0.16% below the 20-period EMA (3,904.58), 1.09% below the 50-period EMA (3,940.99) and 2.89% below the 200-period EMA (4,014.21). Swing structure shows lower swing highs and lower swing lows, which our rules classify as downtrend. RSI(14) is 42.9, below the neutral 50 line. The MACD histogram is +2.54, rising from +2.27 on the previous bar, with the MACD line above its signal line. The ATR(14) is 17.08, or 0.44% of price. Net, the 1-hour timeframe leans bearish (score -5).
15-minute timeframe. In data from Yahoo Finance (COMEX futures), the last completed 15-minute candle (opened 2026-11-13 15:15 UTC) closed at 3,889.40. That is 0.13% below the 20-period EMA (3,894.50), 0.23% below the 50-period EMA (3,898.38) and 1.29% below the 200-period EMA (3,940.38). Swing structure shows higher swing high but lower swing low (widening range), which our rules classify as range expanding. RSI(14) is 44.0, below the neutral 50 line. The MACD histogram is +0.48, falling from +0.85 on the previous bar, with the MACD line above its signal line. The ATR(14) is 9.14, or 0.23% of price. Net, the 15-minute timeframe leans bearish (score -4).
Support and Resistance Levels
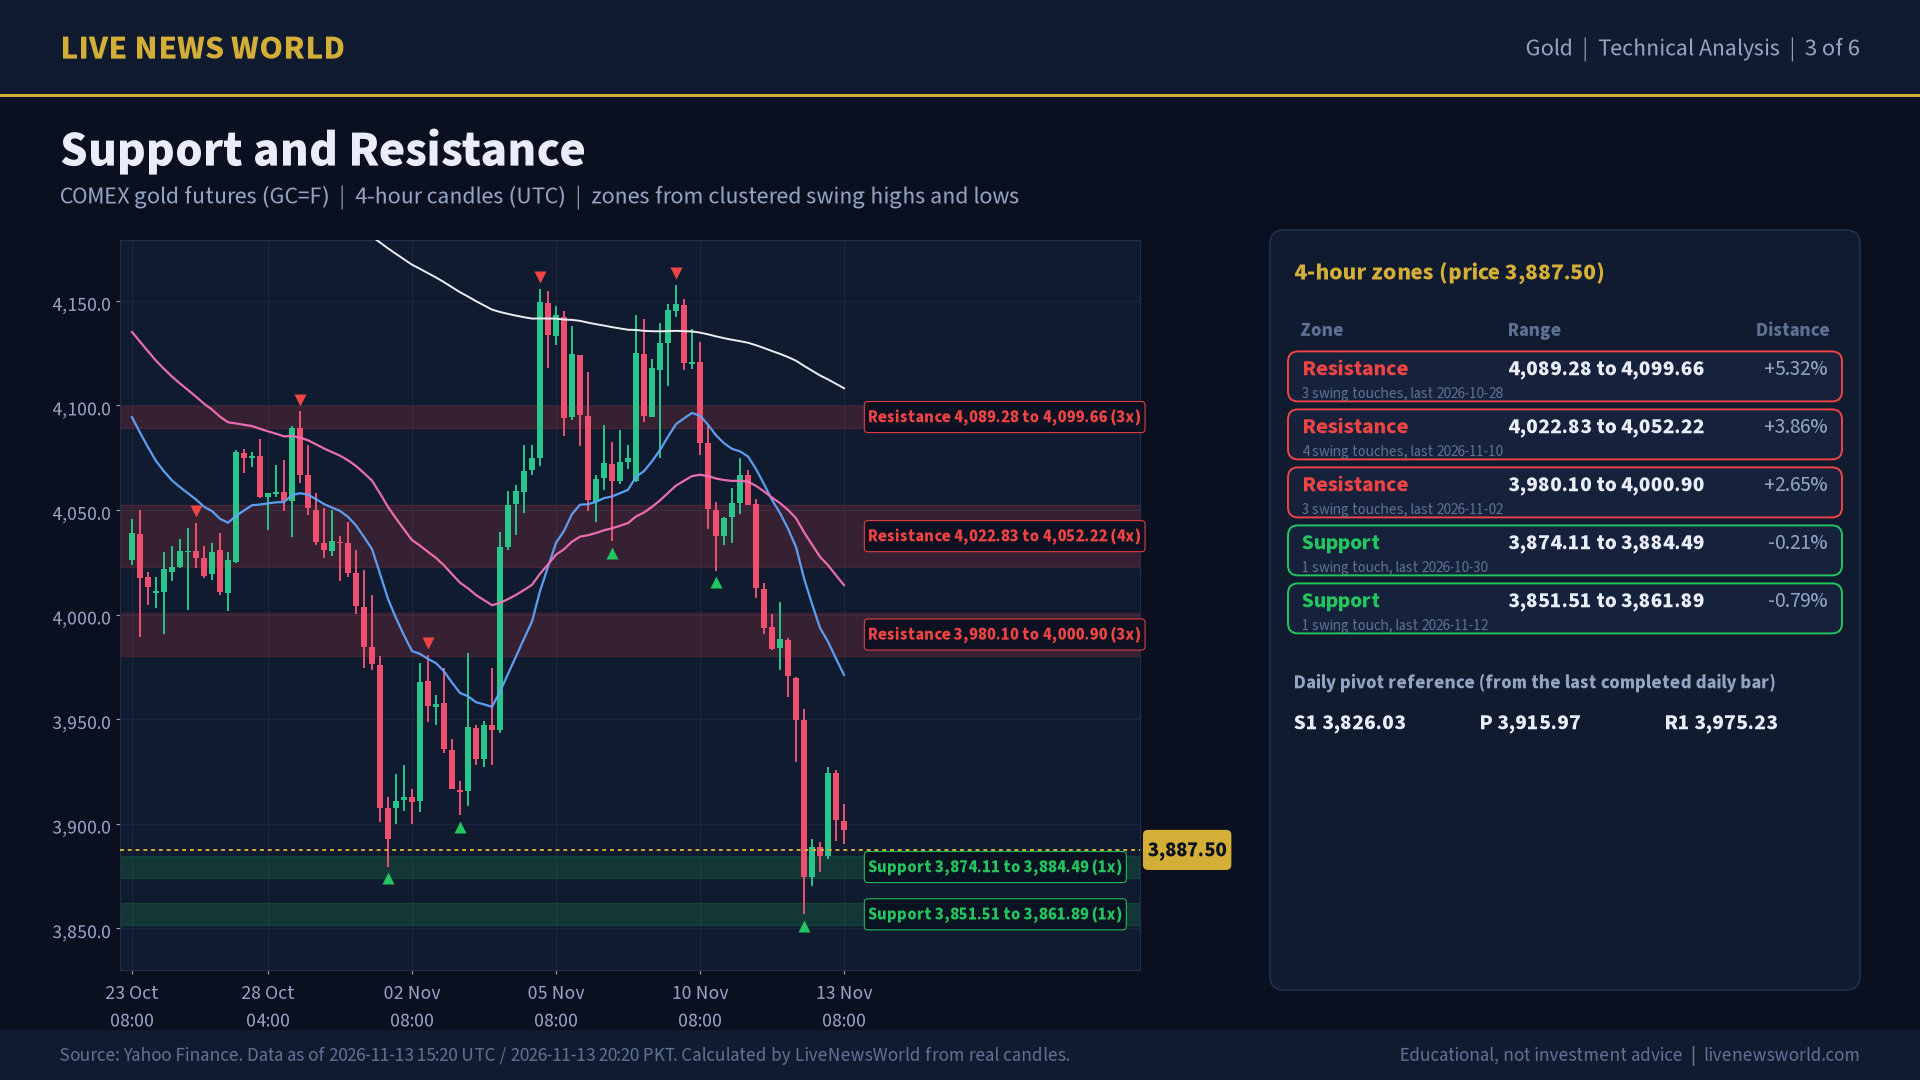
4-hour zones (price 3,887.50). Zones are clusters of swing highs and lows; ‘touches’ counts the swings inside each zone.
| Zone | Range | Touches | Distance from price |
|---|---|---|---|
| Resistance | 4,089.28 to 4,099.66 | 3 | +5.32% |
| Resistance | 4,022.83 to 4,052.22 | 4 | +3.86% |
| Resistance | 3,980.10 to 4,000.90 | 3 | +2.65% |
| Support | 3,874.11 to 3,884.49 | 1 | -0.21% |
| Support | 3,851.51 to 3,861.89 | 1 | -0.79% |
Source: LiveNewsWorld calculations from Yahoo Finance COMEX gold futures (GC=F) candles; data checked 10:30 a.m. ET, Nov. 13, 2026.
Daily zones (price 3,887.50). Zones are clusters of swing highs and lows; ‘touches’ counts the swings inside each zone.
| Zone | Range | Touches | Distance from price |
|---|---|---|---|
| Resistance | 4,143.08 to 4,171.42 | 2 | +6.94% |
| Resistance | 4,056.20 to 4,110.00 | 4 | +5.03% |
| Resistance | 3,956.12 to 3,994.53 | 4 | +2.26% |
| Price zone | 3,865.13 to 3,893.47 | 1 | inside |
Source: LiveNewsWorld calculations from Yahoo Finance COMEX gold futures (GC=F) candles; data checked 10:30 a.m. ET, Nov. 13, 2026.
For reference, the classic daily pivot levels from the last completed daily bar (2026-11-12) are S1 3,826.03, pivot 3,915.97 and R1 3,975.23.
Bullish, Bearish and Neutral Scenarios
These are conditional scenarios built from the levels above. They are not predictions or trade signals.
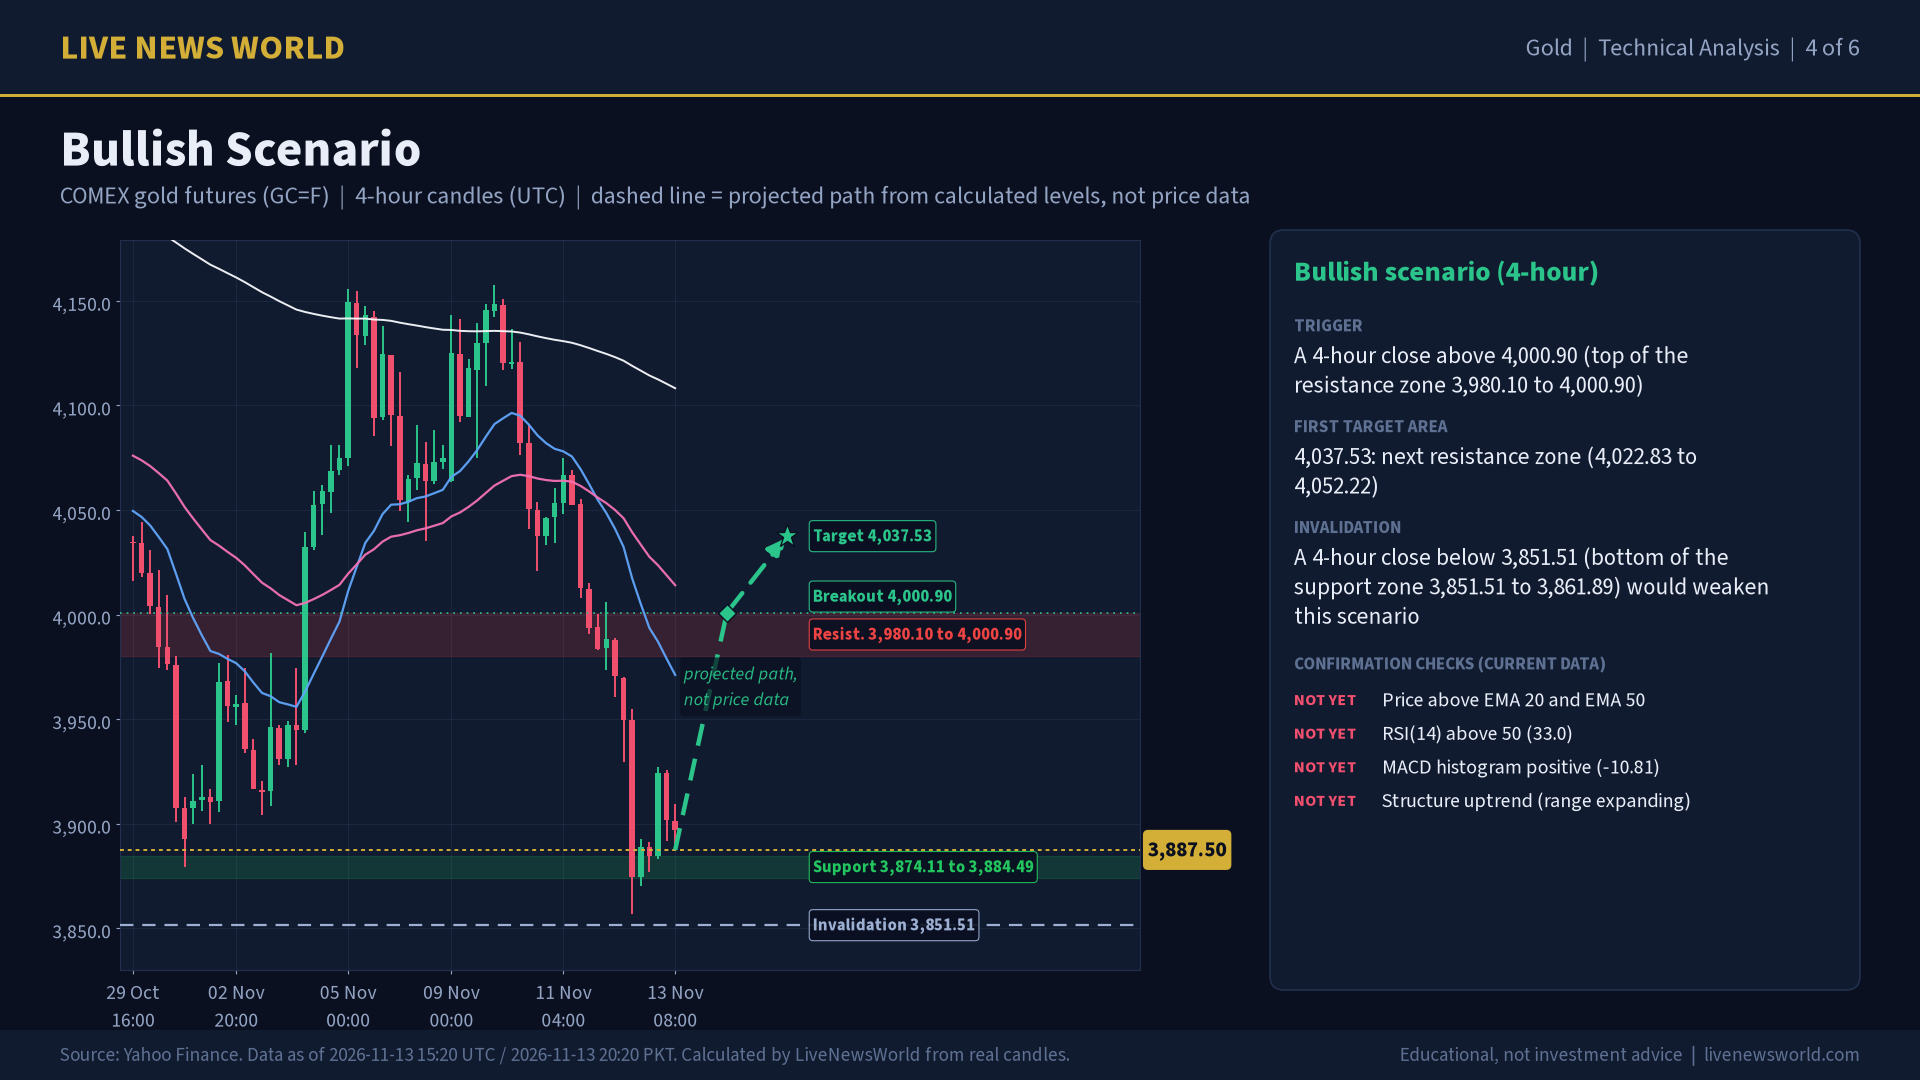
Bullish scenario
Trigger: A 4-hour close above 4,000.90 (top of the resistance zone 3,980.10 to 4,000.90). First reference: 4,037.53, the next resistance zone (4,022.83 to 4,052.22). Invalidation: a 4-hour close below 3,851.51 would weaken the idea.
Bearish scenario
Trigger: A 4-hour close below 3,851.51 (bottom of the support zone 3,851.51 to 3,861.89). First reference: 3,782.32, the 2 x ATR(14) volatility reference below the breakdown level (no further support zone in the data). Invalidation: a 4-hour close above 4,000.90 would weaken the idea.
Neutral scenario
Condition: 4-hour closes stay between 3,851.51 and 4,000.90. In that case Gold stays in a range while price keeps rotating between these zone edges without a confirmed close beyond either one. Mixed signals across timeframes (15m bearish, 1h bearish, 4h bearish, 1d bearish) support patience until a trigger is hit.
Our View (Analysis)
In our analysis, the chart and the macro backdrop currently point the same way: all four timeframes lean bearish in LiveNewsWorld’s calculations, while this week’s inflation data, rising Treasury yields and Fed hike signals have raised the opportunity cost of holding non-yielding gold. That alignment does not make a further decline certain. Friday’s cooler monthly PPI reading, a pullback in yields or a sudden escalation in the Middle East could revive demand, and the nearest 4-hour support zone sits just below the current price. We would treat a 4-hour close outside the 3,851.51 to 4,000.90 range as the clearer signal and read little into moves inside it. This is an opinion, not a forecast or a trade recommendation.
What to Watch Next
Gold is commonly sensitive to the U.S. dollar, Treasury yields and Federal Reserve expectations; see our explainers on what moves gold prices and the 10-year Treasury yield.
Reference pages: World Gold Council gold price data and Federal Reserve FOMC calendar.
Sources and Data Notes
- U.S. Bureau of Labor Statistics: Consumer Price Index, October 2026 (released Nov. 10, 2026)
- U.S. Bureau of Labor Statistics: Producer Price Index, October 2026 (released Nov. 13, 2026)
- Kitco News: Gold rebounds from 13-month low as PPI complicates Fed outlook (Nov. 13, 2026)
- Federal Reserve: FOMC statement, Oct. 28, 2026
- Federal Reserve: Governor Waller, “The Economic Outlook and Some Thoughts on Labor Market Dynamism,” Nov. 10, 2026
- Federal Reserve: FOMC meeting calendar
- U.S. Department of the Treasury: Daily Treasury par yield curve rates, November 2026
- CNBC (Reuters report): Gold drops to over one-year low as fading Middle East peace hopes fan inflation fears (Nov. 12, 2026)
- CNBC: Consumer prices rose 0.4 percent in October, more than expected (Nov. 10, 2026)
- CNBC quotes: Gold COMEX futures (@GC.1) and spot gold (XAU=)
- World Gold Council: Gold price data
Data notes: Yahoo Finance chart API (COMEX gold futures, front month); CNBC @GC.1 (COMEX gold futures, same instrument); CNBC XAU= spot; Swissquote XAU/USD spot mid. Candles are COMEX gold FUTURES (GC=F, front month), not spot XAU/USD. Futures trade at a small premium or discount to spot (the basis); spot is shown as a reference only. Indicators, zones and scenarios are LiveNewsWorld calculations. Yahoo Finance data are delayed and unofficial.
This article is for informational and educational purposes only and does not constitute personalized financial or investment advice. Market conditions can change rapidly.