Key Points
- Gold prices mainly respond to the opportunity cost of holding a non-yielding asset: real yields, the U.S. dollar, inflation trends, and risk sentiment often matter more than any single headline.
- As of early October 2026 packaging, COMEX gold futures (continuous GC=F) were about $4,162 per ounce on October 2, 2026, the 10-year TIPS real yield (DFII10) was 2.88% on October 1, and August 2026 CPI was up 3.4% year over year (Yahoo Finance; FRED).
- Central-bank buying, ETF flows, mine and scrap supply, and geopolitical safe-haven demand can reinforce or overwhelm the usual rate-and-dollar channels in some periods.
- Directional associations in the driver table below are stylized historical patterns, not a trading rule; always check dated official series rather than assuming the last decade’s correlation still holds.
Gold prices move when investors reprice the metal’s role as a store of value, a hedge, and a portfolio diversifier. In practice, the biggest recurring drivers are real interest rates, the U.S. dollar, inflation readings, central-bank demand, risk sentiment, investment flows through ETFs and futures, and the physical supply of newly mined and recycled gold. No single factor dominates every year, which is why gold can rise even when some “usual” supports look weak.
This explainer maps those drivers with verified series where possible, shows recent official readings, and links the rate and inflation backdrop covered elsewhere on LiveNewsWorld, including the federal funds rate, core inflation, and CPI vs PCE.
What “the gold price” usually means
Retail headlines often say “gold” as if there were one number. Traders watch several related benchmarks: London over-the-counter spot references historically associated with LBMA fixing processes, COMEX futures, and ETF indicative values. For this article’s charts and latest reading, we use the publicly available COMEX continuous futures series (Yahoo Finance GC=F), clearly labeled as futures rather than an LBMA fix. FRED’s former ICE Benchmark Administration London gold series was removed and is not reinvented here.
Futures and spot can diverge around delivery, liquidity stress, or contract rolls. For an evergreen explainer, the point is the driver set, not a tick-by-tick forecast.
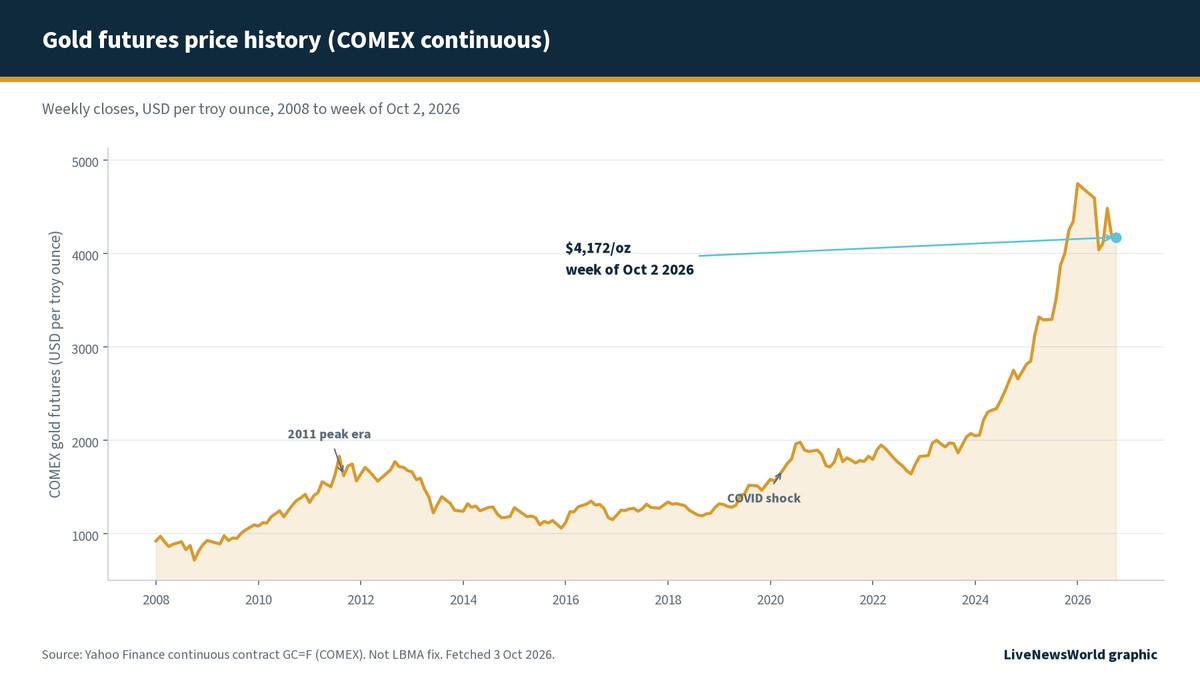
The main drivers of gold prices
Think in opportunity cost and relative value. Gold pays no coupon. When real yields on safe government bonds are high, holding gold is more expensive in forgone income terms. When real yields are low or negative, that opportunity cost falls. The U.S. dollar matters because gold is globally quoted in dollars: a stronger dollar can weigh on the dollar price even if local-currency gold looks steadier for overseas buyers.
Inflation enters twice. First, it shapes real yields (nominal yields minus inflation expectations or realized inflation). Second, some investors buy gold as an inflation hedge when they distrust fiat purchasing power. Those motives can conflict in the same month if nominal yields rise faster than inflation expectations.
Beyond rates and FX, physical and institutional demand matter. Central banks have been net buyers in many recent years according to industry tallies (treat third-party flow estimates cautiously and prefer primary sources when citing a specific tonnage). Exchange-traded products and futures positioning transmit investor risk appetite quickly. Mine supply grows slowly; scrap recycling can respond faster to price spikes. Geopolitical stress can add a safe-haven bid that temporarily overrides textbook rate relationships.
Driver comparison (stylized associations)
The table below summarizes common directional associations used in market commentary. These are historical tendencies, not guarantees. Gold has periods when several drivers pull in opposite directions.
| Driver | Typical association with USD gold price | What to watch |
|---|---|---|
| Real yields (e.g., 10y TIPS) | Higher real yields: often softer gold; lower real yields: often firmer gold | FRED DFII10; Fed policy path |
| U.S. dollar | Stronger dollar: often softer USD gold; weaker dollar: often firmer USD gold | Broad dollar indexes such as FRED DTWEXBGS |
| Inflation (CPI / PCE) | Rising inflation fears can support gold; disinflation can reduce the hedge bid | BLS CPI; BEA PCE; LiveNewsWorld CPI vs PCE |
| Fed / policy rates | Tighter policy can lift real yields and the dollar; easing can do the reverse | Federal funds target; balance-sheet stance (QE/QT) |
| Central-bank demand | Persistent official buying can underpin prices; sales can weigh | IMF/IFS reserve data; central-bank reports (when available) |
| Geopolitics / risk-off | Stress can add a safe-haven bid; calm can remove it | Risk assets, volatility, diplomatic calendars |
| ETF and futures flows | Inflows can amplify rallies; outflows can amplify selloffs | Fund holdings disclosures; futures open interest |
| Mine + scrap supply | Extra supply can cap spikes; tight scrap can tighten physical markets | Producer reports; recycling response to price |
Stylized historical associations for education only. Not investment advice and not a prediction rule. Fetched framing 3 Oct 2026.
Real yields, the dollar, and Fed policy
The cleanest textbook link is gold versus real yields. The 10-year Treasury inflation-indexed security yield (FRED DFII10) is a standard market measure of longer-term real rates. Periods of deeply negative real yields after 2020 coincided with strong gold interest; later increases in real yields raised the opportunity cost again. That inverse link is imperfect: if investors fear financial repression, currency debasement, or geopolitical shocks, gold can climb even while real yields rise.
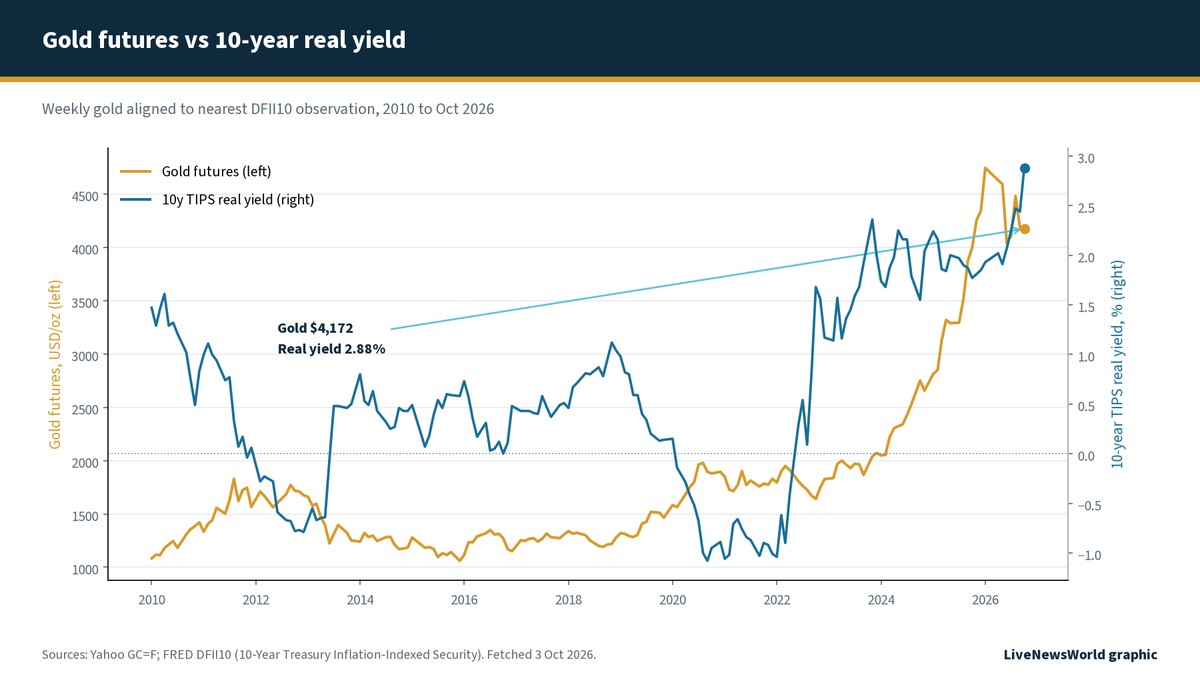
The dollar channel overlaps with Fed policy. A more restrictive federal funds path can support the dollar and lift real yields together, a double headwind for USD gold in the textbook case. Balance-sheet policy sits in the background: large-scale asset purchases and runoff change the stock of safe duration and reserves, which can influence term premiums and risk appetite. LiveNewsWorld covers those tools in quantitative tightening and related Fed explainers. The dollar’s global role is also discussed in world’s strongest currency.
Inflation readings and what they do not prove
As of the latest complete months available on 3 Oct 2026, August 2026 CPI was 3.4% higher than a year earlier (BLS via FRED CPIAUCSL), August headline PCE was about 3.4% year over year, and core PCE was about 3.0% year over year (BEA via FRED PCEPI and PCEPILFE). Those readings describe recent consumer-price trends; they do not by themselves tell you where gold will trade next week.
Gold’s inflation-hedge reputation is strongest when inflation surprises are persistent and real yields fail to compensate. When central banks hike aggressively and real yields jump, the hedge can look expensive even if CPI is still elevated. That is why serious readers watch inflation and real yields together, not CPI alone.
Latest useful readings (fetched 3 Oct 2026)
| Series | Latest reading | As-of date | Source |
|---|---|---|---|
| COMEX gold futures (GC=F continuous) | $4,162 / oz (daily close) | Oct 2, 2026 | Yahoo Finance |
| 10-year TIPS real yield (DFII10) | 2.88% | Oct 1, 2026 | FRED |
| 10-year nominal Treasury yield (DGS10) | 5.24% | Oct 1, 2026 | FRED |
| Trade-weighted broad USD (DTWEXBGS) | 120.33 | Sep 25, 2026 | FRED |
| CPI, 12-month change | 3.4% | Aug 2026 | BLS via FRED CPIAUCSL |
| Core PCE, 12-month change | 3.0% | Aug 2026 | BEA via FRED PCEPILFE |
Snapshot for context on 3 Oct 2026 PKT packaging day. Gold figure is COMEX futures, not an LBMA London fix. Percent changes rounded to one decimal where shown.
Supply, central banks, and flows
Mine production expands slowly because new projects take years. Scrap supply is more elastic: when prices jump, recycling often rises. That physical layer rarely sets the day-to-day futures print, but it shapes how far a squeeze or a dump can travel.
Central-bank reserve managers can add a structural bid when they diversify away from concentrated currency reserves. Exact tonnage should be cited from primary statistical releases when used; this evergreen piece does not invent a specific purchase total. ETF creations and redemptions, by contrast, show up quickly in market commentary and can amplify moves that rates and the dollar already started.
Geopolitics and safe-haven demand are real but hard to quantify. They help explain episodes when gold rises alongside higher yields or a firm dollar, which violates the simple one-factor model. The inverted yield curve can sit in the same broader risk conversation without being a gold formula.
How to read gold without treating it like a single-factor trade
Build a checklist, not a slogan. Ask: What happened to real yields? What happened to the dollar? Did inflation surprise? Is the Fed’s rate path and balance-sheet stance shifting expectations? Are investors adding or cutting fund exposure? Is there a geopolitical shock large enough to overwhelm the checklist?
If several answers conflict, expect choppy price action. Gold’s long history includes multi-year bull and bear phases that look obvious only in hindsight. Use dated series, label your benchmark (futures versus spot fix), and avoid inventing LBMA or COMEX numbers you did not fetch.
Common misconceptions about gold prices
“Gold always rises when inflation rises.” Not reliably. Inflation that arrives with much higher real yields can still leave gold under pressure.
“The Fed funds rate alone sets the gold price.” The overnight policy rate matters mainly through real yields, the dollar, and risk sentiment. Balance-sheet policy and global demand also matter.
“One chart of gold versus yields is a complete model.” Useful, not complete. Central banks, ETF flows, and geopolitics can dominate for stretches of time.
“Any gold number online is the official London fix.” Benchmarks differ. This article uses COMEX continuous futures for charting because the old FRED LBMA series is unavailable; captions say so explicitly.
Video: what affects the price of gold
Capital.com’s short explainer summarizes common gold-price drivers for a general audience. Preview the embed before relying on it in a live post.
Video: “What affects the price of Gold?,” Capital.com. Title and publisher verified via YouTube oEmbed on 3 Oct 2026.
Frequently asked questions
Do higher interest rates always crush gold?
Not always. Higher nominal rates matter most when they lift real yields and support the dollar. If inflation expectations rise even faster, or if safe-haven demand surges, gold can hold up or rise anyway.
Is gold a perfect inflation hedge?
Gold is often discussed as an inflation hedge, but its short-run correlation with CPI or PCE is unstable. It has worked better as a long-horizon store of value in some fiat-debasement narratives than as a month-to-month CPI tracker.
Where can I track the drivers used in this article?
For real yields, see FRED DFII10. For the broad dollar, see FRED DTWEXBGS. For inflation, use BLS CPI and BEA PCE releases (and LiveNewsWorld’s CPI vs PCE explainer). For gold futures levels, use an exchange or reputable market-data vendor and note whether you are looking at futures or a London spot reference.
The bottom line
What moves gold prices is a stack of forces: real yields and the dollar set the opportunity-cost baseline; inflation, Fed policy, central-bank demand, ETF flows, physical supply, and geopolitics bend that baseline. Use official rate, FX, and inflation series, label your gold benchmark honestly, and treat any one-factor story as incomplete. Gold is a market price, not a morality play.